Figures & data
Figure 1. Photos of helper (left) and sprayer (right). The helpers cut and bundled freshly sprayed foam, sometimes without coveralls or gloves. The sprayer usually wore partial coverall, gloves, and an air-supplied respirator for protection from overspray.
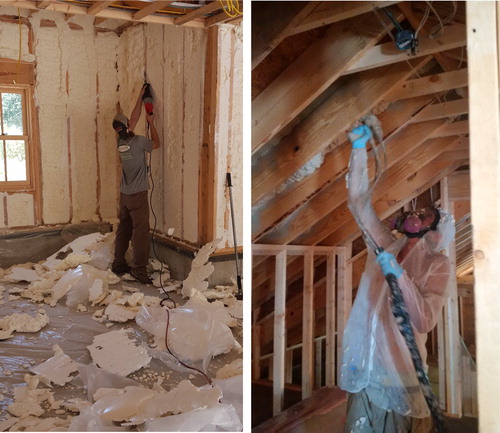
Table 1. Characteristics of participating spray polyurethane foam workers.
Table 2. Flame retardant metabolites quantified in urine samples.
Figure 2. TCPP air concentrations by job position (N = 29). The box represents the interquartile range, the line in each box represents the median, and the triangle represents the GM. The upper whisker represents the far upper fence 1.5 IQR above the 75th percentile, the lower whisker represents the lower fence 1.5 IQR below the 25th percentile, and the circles represent outliers.
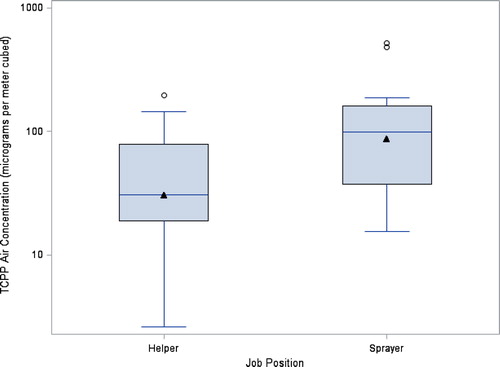
Table 3. TCPP hand wipe concentrations* (ng/sample) and comparisons.
Table 4. Urine sampling concentrations* using paired t-test (μg/g cr).
Table 5. Univariate analysis results using a mixed model with company as a random effect.
Table 6. Multivariate analysis results using a mixed model with company as a random effect.
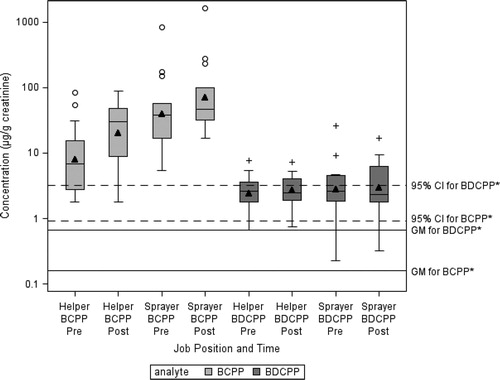
Figure 3. BCPP and BDCPP creatinine-adjusted urine concentrations by position and time compared to the adult male general population (N = 29). The box represents the interquartile range, the line in each box represents the median, and the black triangle represents the GM. The upper whisker represents the far upper fence 1.5 IQR above 75th percentile, the lower whisker represents the lower fence 1.5 IQR below the 25th percentile, and the circles represent outliers. *The GM and 95th% CI for BCPP and BDCPP were general population averages calculated using the National Health and Nutrition Examination Survey 2013–2014 (men above age 18).