Figures & data
Table 1. Summary of area air sampling methods.
Table 2. Summary of personal air concentrations by type of participant and fuel package.
Table 3. Area air concentrations of acid gases inside structure by type of fuel package.
Table 4. Area air concentrations of aldehyde and isocyanates inside structure by type of fuel package.
Figure 1. VOCs (ppm) area air concentrations inside structure by type of fuel package: pallet and straw (n = 4), Alpha OSB (n = 2), and Bravo OSB (n = 2). OSB scenarios also included two pallets and one bale of straw. Pallet and straw scenarios included three pallets and one bale of straw. The box and whiskers provide the minimum, 25th percentile, median, 75th percentile, and maximum values.
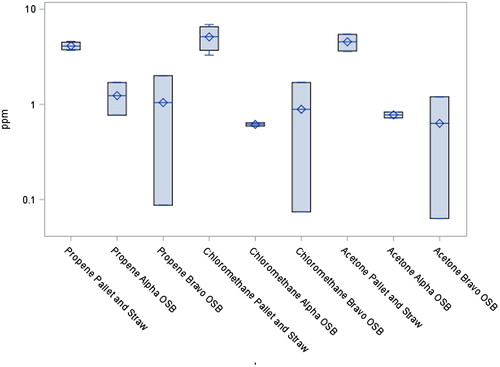
Table 5. VOCs air concentrations by location and type of fuel package.
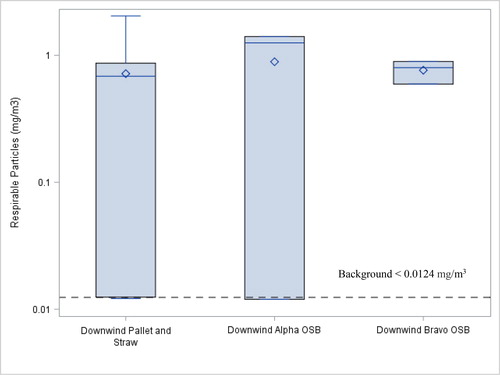
Figure 2. Downwind area air concentrations (mg/m3) of respirable particles by type of fuel package. All background samples were non-detect. The box and whiskers provide the minimum, 25th percentile, median, 75th percentile, and maximum values.