Figures & data
Figure 1. Measurement setup: Each worker had one respirable cyclone (3) and two UNC samplers (1 and 2) fastened to their workwear.
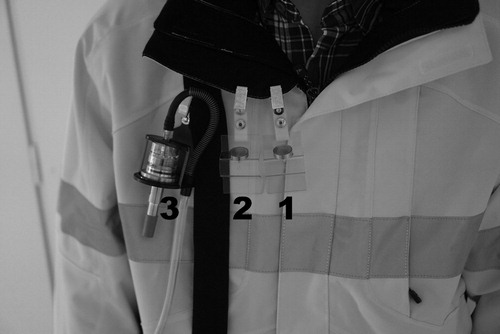
Table 1. Overview of activities during the nine measurement events.
Figure 2. The whole UNC sampler collection surface imaged with a SEM. The particles were deposited heterogeneously, with a higher particle surface loading in a circular shape at the edge of the collection surface.
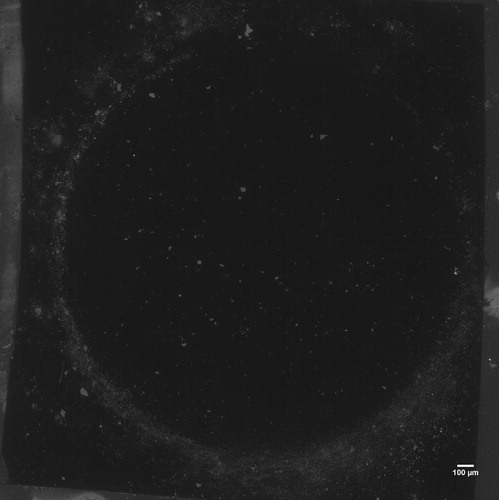
Figure 3. Four example particle collection surfaces imaged from different UNC samplers with a SEM. The particles almost exclusively resembled gravel. Panels (a), (b), and (d) show particles at the edge of the collection area, and panel (c) shows particles from the center of a deposition surface. The particle surface loading on the surface edge was generally higher than on the center of a deposition surface.
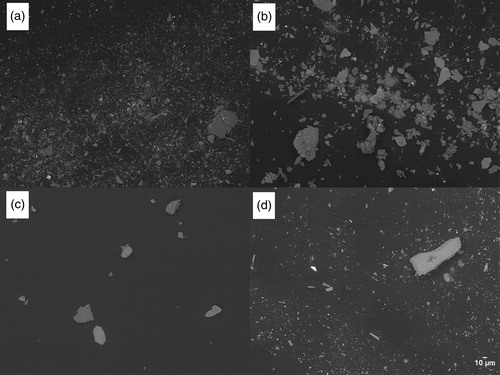
Figure 4. Normalized mass concentration distributions (dM/dlogda) for the 18 UNC samplers calculated using the (a) mesh factor and (b) area factor.
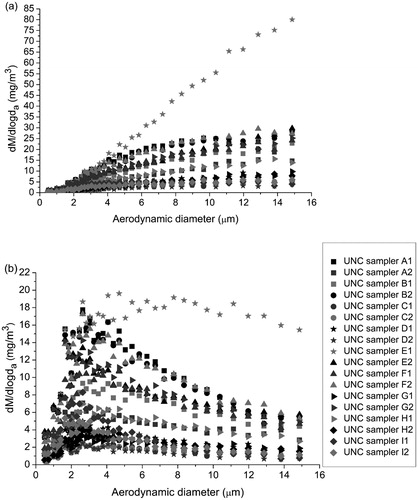
Figure 5. (a) Mass concentrations of the respirable cyclone vs. the UNC sampler. (b) Mass concentrations of the respirable cyclone vs. the UNC sampler mean mass concentrations, with the respirable cyclone outlier (high concentration) removed.
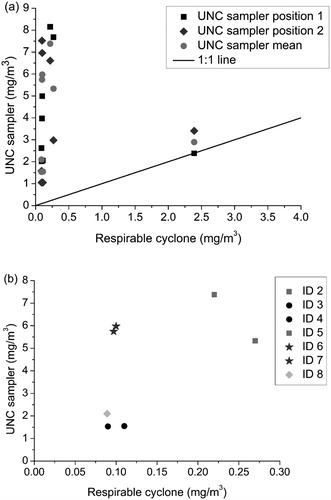
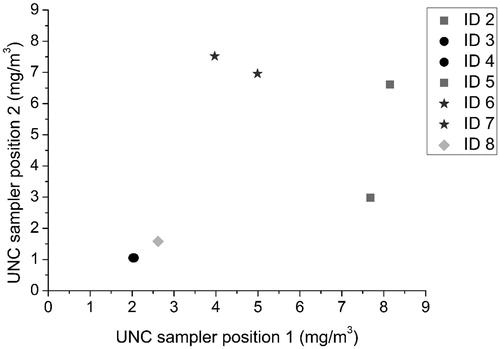
Figure 6. Mass concentrations for the seven paired measurements for the UNC sampler Position 1 vs. the UNC sampler at Position 2 with the respirable cyclone outlier (see ) removed. The points for ID 3 and 4 overlap.