Figures & data
Figure 1. Example of a McIntyre Powder aluminum canister. (A) Top view. (B) Side view. All McIntyre Powder canisters obtained for this study did not display a date of manufacturing, serial number, or lot number information.
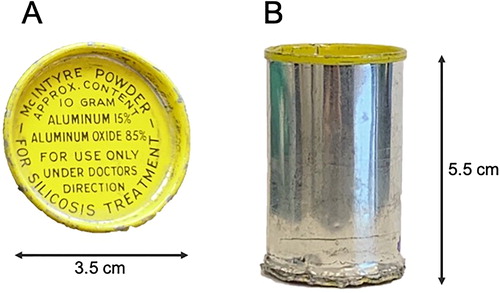
Figure 2. A 1944 electron micrograph of McIntyre Powder particles (10,000X magnification). This image was taken directly from the paper entitled “The engineering aspects of aluminium prophylaxis” by A.W. Jacob published in Transactions, XLVII:185–202 (1944). Reprinted with permission of the Canadian Institute of Mining, Metallurgy and Petroleum.
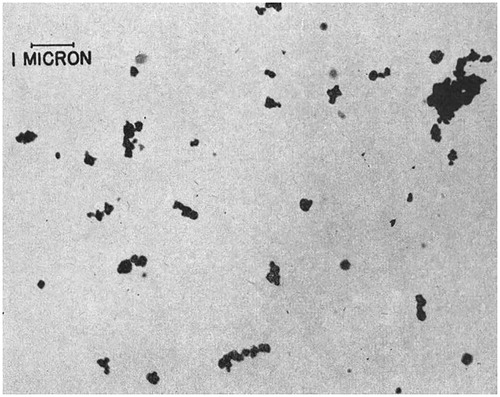
Table 1. Characterization of prototype and modified McIntyre Powder samples by the McIntyre Research Foundation in 1950s.[Citation18,Citation19] Particle size distribution after dispersal in air, using light microscopy (1500X magnification). Both powders analyzed were reported to be black in color. Modified technique received patent in 1958.
Figure 3. Atomic Force Microscopy (AFM) particle size analysis of light grey McIntyre Powder: 1 mg/mL suspension of McIntyre Powder in Milli-Q filtered water. (A) Example of an image generated during the AFM analysis; (B) particle size distribution within supernatant; and (C) particle size distribution of particles smaller than 40 nm in diameter.
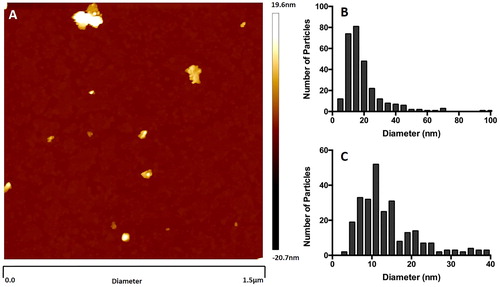
Table 2. Dynamic Light Scattering (DLS) particle size analysis of light grey McIntyre Powder: Zeta potential and size (hydrodynamic diameter) of particles in supernatant, and in top and bottom subsamples of the centrifugate. All values are mean ± SD; n = 3.
Figure 4. Transmission Electron Microscopy (TEM) image of light grey McIntyre Powder on a carbon grid: TEM images show the presence of agglomerates that include lamellae and rod-like structures, and that the powder is characterized by variable porosity.
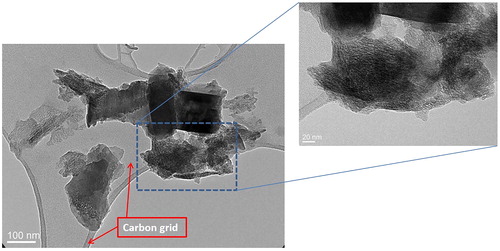
Figure 5. Transmission Electron Microscopy (TEM) analysis of light grey McIntyre Powder particles: (A) table of crystallographic data confirming the particle in image B is primarily composed of aluminum; (B) TEM image of McIntyre Powder particle; and (C) example of interplanar distances and diffraction pattern image.
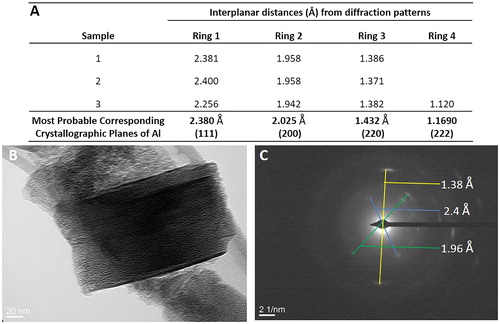
Figure 6. X-ray Diffraction (XRD) spectra comparing mineralogical composition of (A) light grey McIntyre Powder vs. (B) black McIntyre Powder. Difference in Y-axis scale between (A) and (B) is due to longer collection time for (A).
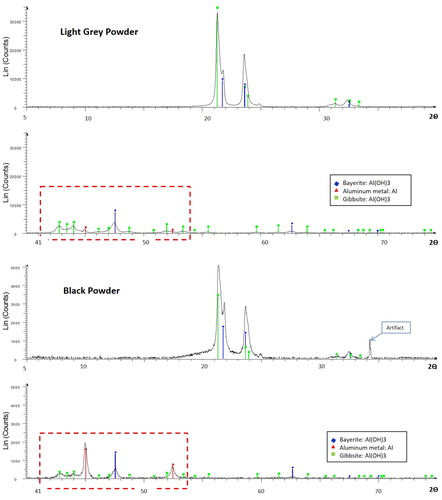
Table 3. Chemical Composition of light grey and black McIntyre Powders.
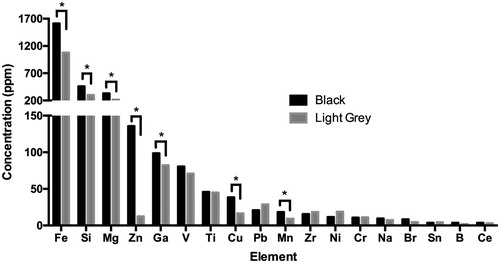
Figure 7. Comparison of elemental contaminant concentrations in black vs. light grey McIntyre Powder (MP) determined by ICP-MS and ICP-OES. Note that primary y-axis refers to Fe, Si and Mg concentration, and secondary y-axis refers to concentration of remaining elements from Zn to Ce. *Asterisk indicates elements displaying statistically significant difference in concentration between light grey MP and black MP. Although not included in the bar graph, the Al content of the black MP sample determined by ICP-OES (41.1% ± 0.7%) was also significantly higher (p < 0.001) than the average Al of the four light grey samples (32.4% ± 0.6%; expressed as ppm in Supplementary Table A).