Figures & data
Figure 1. Climate chamber schematic. Sampling positions for chemical analysis is marked as Tenax TA and XAD-2. Aerosol measurements were performed in the middle and in the right side of the chamber. For wiping surfaces fields were drawn on the wall in the sprayed corner and the opposite corner and on the steel plate on the floor in the sprayed corner.
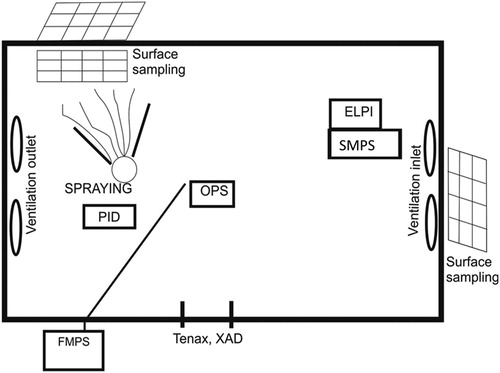
Table 1. Spray characterization of the three biocidal spray products.
Table 2. Parameters and settings in the ConsExpo Web simulations and selected results for the active substances. Experimental values inserted in place of default values are underlined.
Figure 2. Concentration vs. time data for active substances and alkanes after spraying Biocide 1 in the chamber (data from one experiment). The lines are the fitted first-order decay functions (see ). The black dotted line shows a decay following the air exchange rate. The ConsExpo Web curve is based on the many parameter scenario.
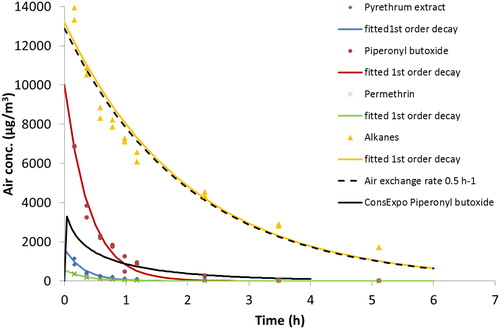
Table 3. Measured maximum air concentrations (out of 2–3 experiments) emitted during application of the biocidal spray products, parameters of fitted first-order decay model (k1 and C0 in EquationEquation (1)(1)
(1) ) with two-sided confidence limits, and available occupational exposure limit values.
Figure 3. Total particle number and mass concentrations measured by the OPS vs. time in the chamber after spraying Biocide 1 (A), Biocide 2 (B), and Biocide 3 (C) (data from one experiment).
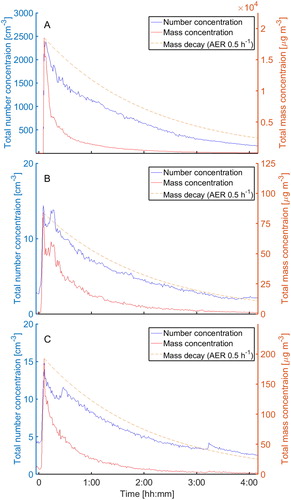
Table 4. Mean surface and dermal exposure concentrations of substances emitted during application of biocidal spray products.
Figure 4. Concentration vs. time data for organic substances after spraying Biocide 2 in the chamber (data from one experiment).
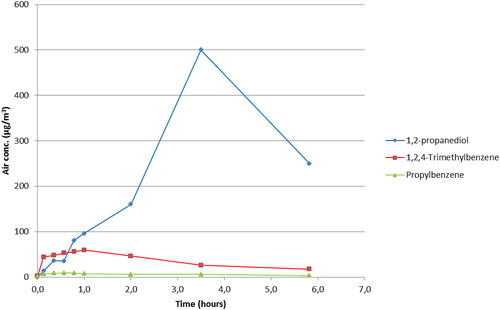
Figure 5. Concentration vs. time data for active substances after spraying Biocide 3 in the chamber (data from one experiment). The lines are the fitted first-order decay functions (see ). The ConsExpo Web curve is based on the many parameter scenario.
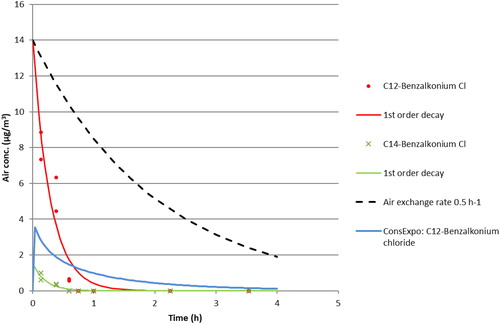
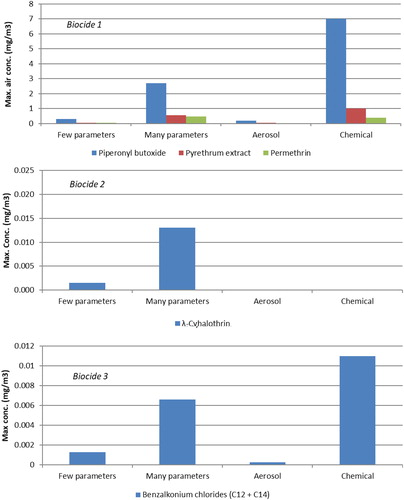
Figure 6. Comparison of simulated peak and experimental maximum exposure concentrations of Biocide 1 after one spray event. Columns termed Few and Many parameters are simulated exposure concentrations in ConsExpo Web and columns termed Aerosol and Chemical are exposure concentrations estimated based on aerosol and chemical measurements, respectively.