
Figures & data
Figure 1. Components inside a CO-IoT module. Components of a CO-IoT module with a printed circuit board hosting CO sensor, LoRa transceiver and electronics. 3D printed brackets were used as structural components inside a standard electronics enclosure.
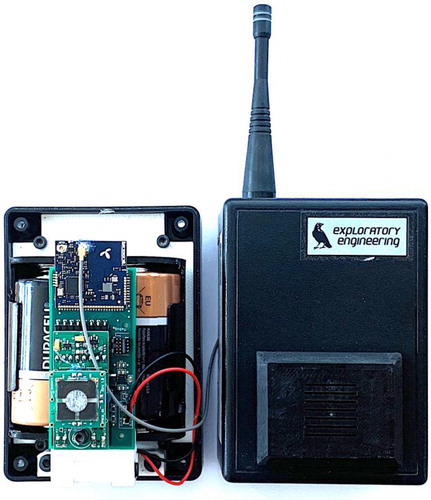
Figure 2. High-level data flow diagram. IoT CO sensor application architecture overview. The battery-driven IoT sensors sample the CO concentration at regular intervals and transmits this data over LoRa using the LoRaWAN protocol.
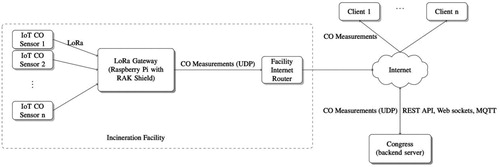
Figure 3 (a–c). Raw data from the field measurements. Raw data measurements of CO when CO-IoT modules were depolyed close to the incinerator (a), close to the recycling fan (b), or close to a slag transporter belt (c) for more than 50 days without loss of measuring data throughout the period. Day to day variations and rapid signal responses could be seen at the three different locations.
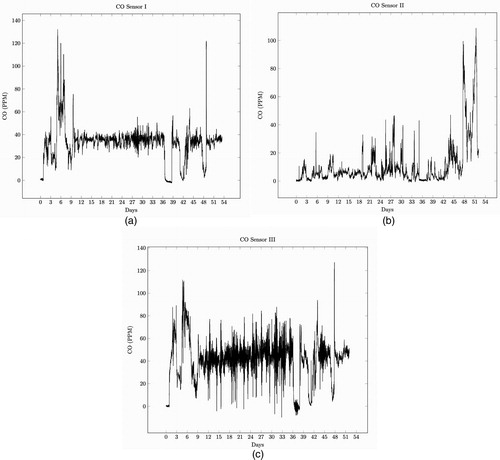
Table 1. Mean, standard deviation (SD), and minimum and maximum values from the CO measurements made by the CO-IoT modules when deployed in the incineration plant for more than 50 days, as showed in .
Figure 4. Field measurements when SPEC sensors were co-located with the Dräger instrument. Measured CO concentrations made by the CO-IoT modules when co-located with a Dräger instrument over a period of approximately 11 hr and close to a transporter belt for toxic slag. Discrepancy between measurements were seen along with increasing CO levels suggesting a skewing of IoT sensor responses caused by interfering agents in the vicinity.
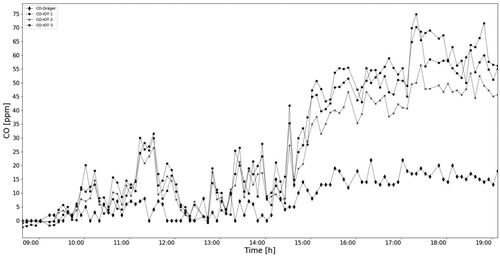
Figure 5. SPEC sensor laboratory test. SPEC sensor measurements shown as the percentage of the measured value from a Dräger instrument (dotted line). Sensors were exposed to 20 ppm “±” 2 ppm CO calibration gas and the mean and SD (shaded area) from 3 independent tests are shown. The mean error was within “±” 25% of the estimated true value and in compliance with NIOSH criterion for accuracy.
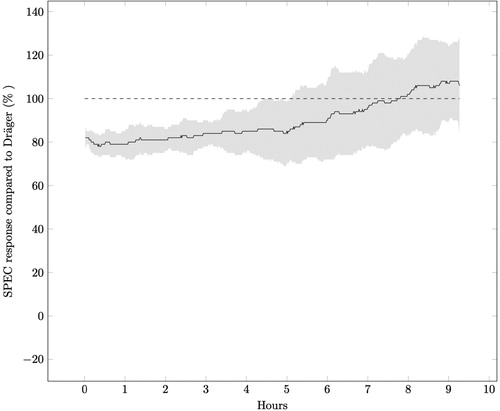
Table 2. Mean, standard deviation (SD), and minimum and maximum values from the CO measurements made by the CO-IoT modules and Dräger instrument when co-located close by the slag transporter belt for approximately 11 hr, as showed in .
Table 3. Accuracy and correlation between data points (n = 72) when CO-IoT 1, 2, and 3 were co-located with a Dräger x-am 5600 instrument close to the slag transporter belt. Mean errors (%) between the measurements made by the CO modules vs. Dräger instrument showed that there were no compliance with the NIOSH criterion for accuracy (95% CI estimated mean error of 25%), while the R2 (coefficient of determination) indicated 69–70% relative co-variations between the measurements.