
Figures & data
Table 2. Typical values assumed for office vs. laboratory spaces.
Figure 1. Example room configurations for (a) laboratory and (b) office settings. In the laboratory shown, two work spaces are identified with negligible mixing of air between them. Each work space has a separate AHU with fresh air output and HEPA-filtered recirculation. In the office, the presence of one worker precludes workers in other areas, and recirculated air is not filtered. Both rooms are held at positive pressure.
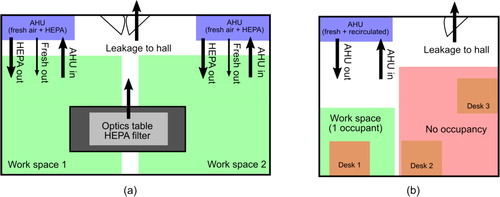
Table 1. Values of model parameters assumed for example risk calculations.
Supplemental material