Figures & data
Figure 1. Non-vented NIV mask in combination with a viral-proof filter as indicated by the black arrows.
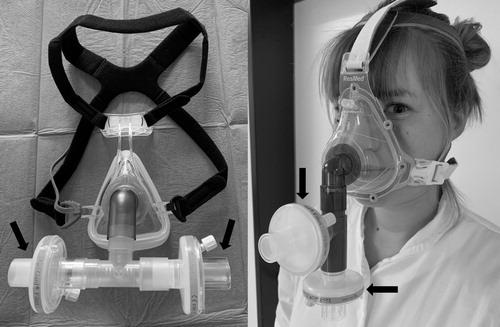
Figure 2. Mannequin head. Nasal and mouth openings of the mannequin connect to a tube/outlet that exits the head on the backside (A–D). This outlet connects to a filter outside the measuring box (E). A soft wound dressing simulates the elastic properties of facial skin (D).
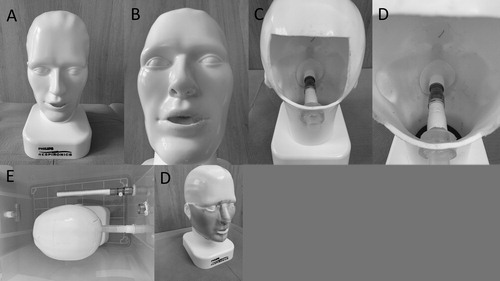
Figure 3. Airtight transparent measuring box connected to a dual test lung; see the Materials and Method section for details.
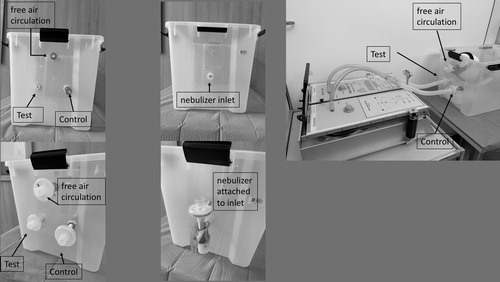
Figure 4. Workflow of the experiment.

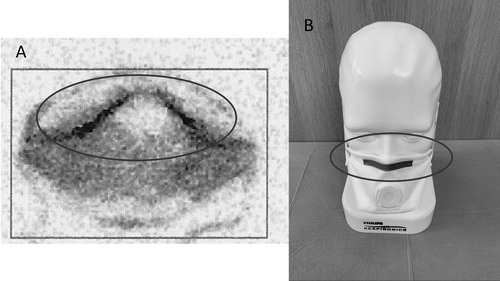
Figure 5. Part A shows the scintigraphic image of the radioactive items shown in part B. The table shows the radioactive counts for the respective items.
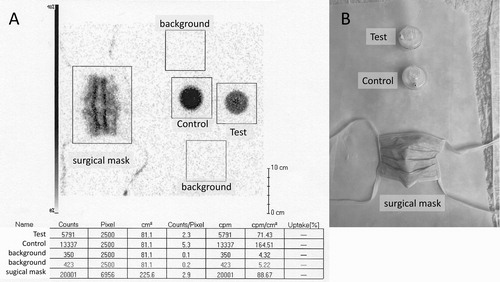
Figure 6. Surgical masks and respirators that were tested on the mannequin head during simulation of spontaneous breathing as described in the Materials and Method section (A: Vlies mouth protector Typ 3 R,Wiros GmbH Willich, Germany; B: OP Mask 657000, Mölnlycke Health Care GmbH, Düsseldorf, Germany; C: FFP 3 mask P-3900, Ampri GmbH, Winsen/Luhe, Germany; D: SH 2950 respirator N95, San Huei United CO. LTD, Taipei, Taiwan).
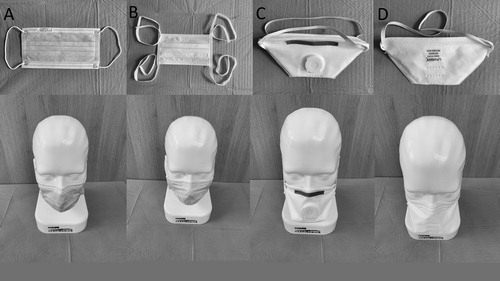
Figure 7. Tested NIV masks (A: AcuCare, ResMed, San Diego, USA; B: JOYCEclinic FF Loewenstein, Bad Ems, Germany; C: Mirage Quattro FX, ResMed, San Diego, USA) and a woven scarf (D, Passigatti, Neu-Ulm, German, 65% polyester, and 35% viscose) which were tested on the mannequin head during simulation of spontaneous breathing as described in the method section. The simulated protection factor of the different masks on the mannequin head is being determined by the filtration efficiency of the tested device and the leakage around the device on the dummy head. In order to determine the performance of a surgical mask without leakage, we clamped a surgical mask over a plastic cup which was connected instead of the mannequin head (E).
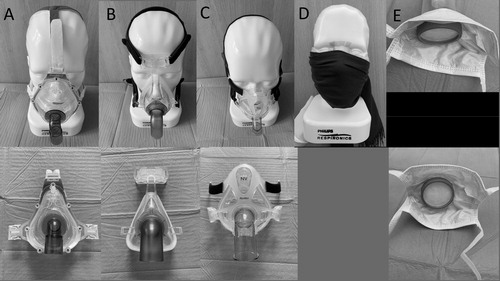
Figure 8. Simulated protection factors of the tested devices.
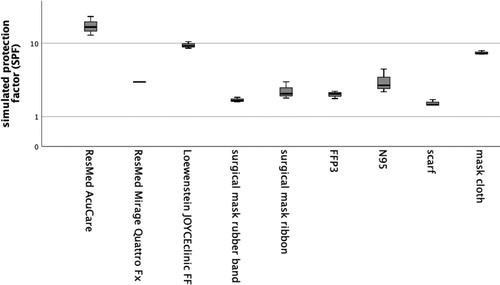
Table 1. Differences of the simulated protection factor between the tested devices.
Figure 9. Increased radioactivity is seen around the upper edge of the respirator indicating leak flow in this area (A: scintigraphic image of the mounted mask (B)).