Figures & data
Figure 1. Illustration of where the samples were collected from the studied house.
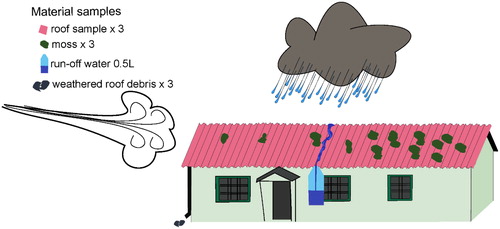
Figure 2. (A) Corrugated asbestos cement covered by moss.( B) Moss and asbestos fibers in a light microscope to the right.
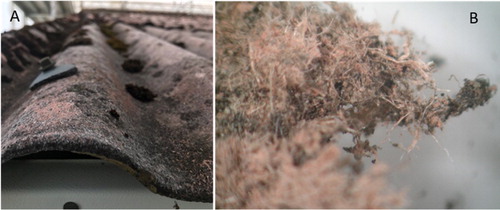
Figure 3. (A) SE image of exposed asbestos fibers on the roof surface. (B) SE image of the underside of the asbestos cement roof.
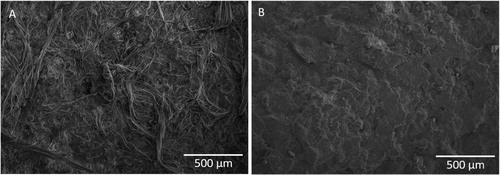
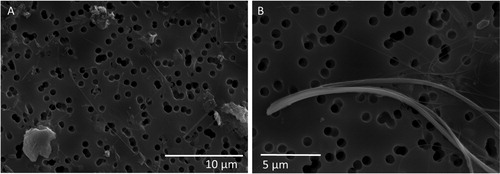
Figure 4. (A) Overview of the weathered roof debris sample with soil particulates and asbestos fibers. (B) A close-up of an example of chrysotile asbestos fiber in the weathered roof debris sample in (B).
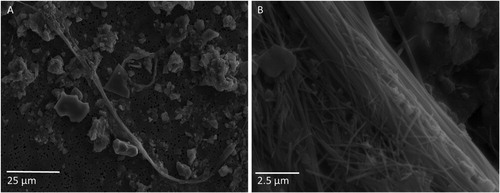
Figure 5. Average chemical composition of chrysotile fibers from moss (n = 53), uncovered roof surface (n = 34) and the roof underside (n = 23). Error bars show the 95% confidence interval.
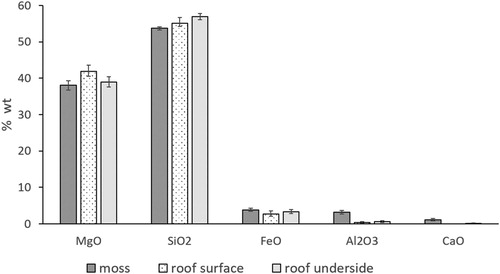
Figure 6. Overview of some moss leaves (A) and (B) asbestos fibers can be found tangled in the moss sample.
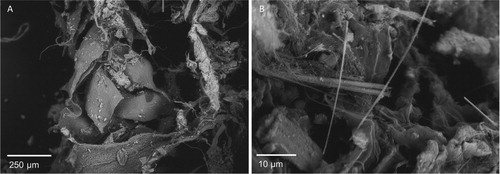
Figure 7. Overview image of the water sample to the left (A), and a magnified SEM image of a chrysotile fiber from the run-off water sample to the right (B).