Figures & data
Figure 1. Study design and sample collection strategy.
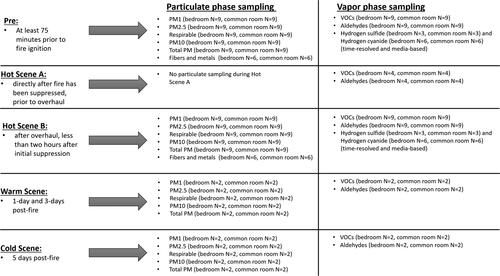
Figure 2. Structure layout and sampling locations selected for the bedroom and common room (kitchen and living room) fire experiments.
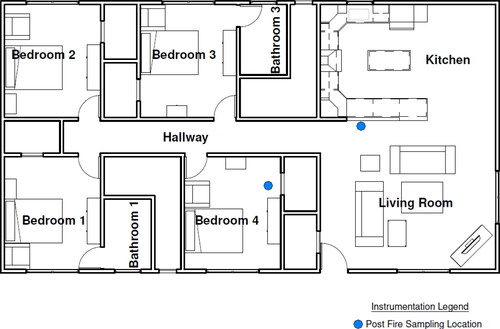
Figure 3. Photographs of typical furnishings in the bedroom fires (top) and common room fires including kitchen (middle) and living room (bottom).
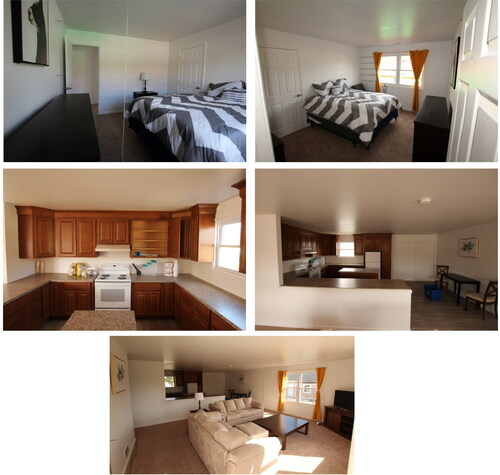
Table 1. Area air sampling collection and analysis methods.
Table 2. Average particulate concentration (µg/m3) for submicron (PM1), less than 2.5 µm (PM2.5), respirable, less than 10 µm (PM10), and total fractions for all eighteen experiments as well as bedroom and common room fire experiments over a 60-min data collection period. Data are presented as median (range).
Table 3. Peak particulate concentration (µg/m3) for submicron (PM1), less than 2.5 µm (PM2.5), respirable, less than 10 µm (PM10), and total fractions for all 18 experiments as well as bedroom and common room fire experiments. Data are presented as median (range).
Figure 4. Respirable (left) and total (right) 60-min average (top) and peak (bottom) particulate concentrations (µg/m3) for 4 experiments including Hot Scene B (immediately post-fire sample at time = 0 hr), Warm Scene (1-day and 3-day post-fire samples at approximately 24 and 72 hr) and Cold Scene (5-day post fire samples at approximately 120 hr).
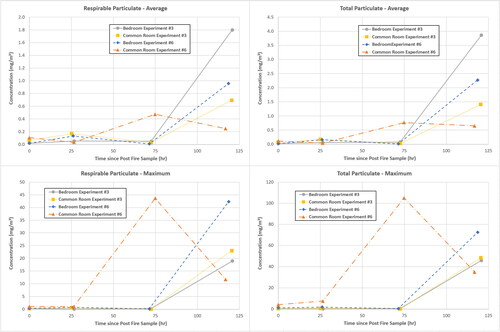
Table 4. Airborne concentration of VOCs (µg/m3) as 60-min time-weighted averages for pre-fire and Hot Scene B and averaged over 30–41 min in Hot Scene A. Data are presented as median (range).
Table 5. Airborne concentration of aldehydes (µg/m3) as 60-min time weighted averages for pre-fire and Hot Scene B and averaged over 30–41 min in Hot Scene A. Data are presented as median (range).
Figure 5. Benzene (top) and naphthalene (bottom) 60-min time-weighted average concentrations (µg/m3) for four experiments including Hot Scene B (immediately post-fire sample at time = 0 hr), Warm Scene (1-day and 3-day post-fire samples at approximately 24 and 72 hr) and Cold Scene (5-day post-fire samples at approximately 120 hr).
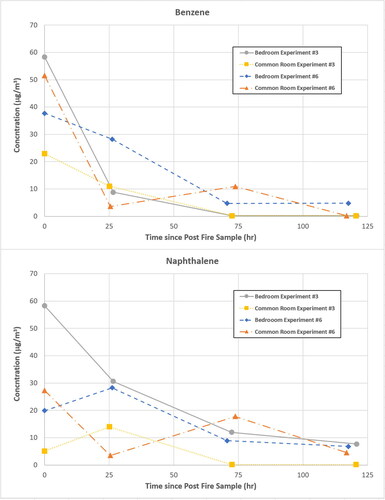
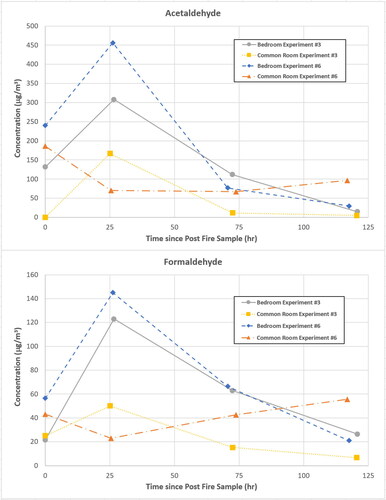
Figure 6. Acetaldehyde (top) and formaldehyde (bottom) 60-min time-weighted average concentrations (µg/m3) for 4 experiments including Hot Scene B (immediately post-fire sample at time = 0 hr), Warm Scene (1-day and 3-day post-fire samples at approximately 24 and 72 hr) and Cold Scene (5-day post-fire samples at approximately 120 hr).