
Figures & data
Figure 1. Experimental setup: (a) experimental chamber, (b) measurement of particle size distributions with and without the lid, and (c) visualization of the particle plumes and quantification of the contamination on the lid.
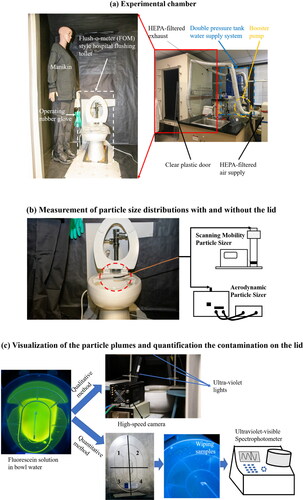
Figure 2. Calibration curve for fluorescein using an ultraviolet-visible Spectrophotometer.
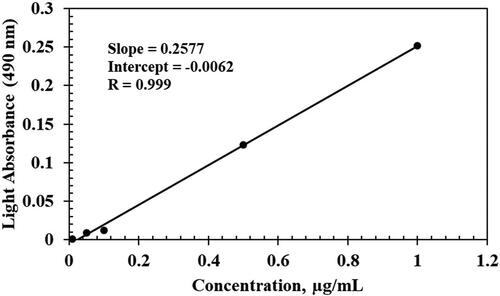
Figure 3. Baseline corrected particle concentration change over time with and without a lid after flushing for (a) particle size from 0.016–0.593 µm (mobility diameter, and (b) particle size from 0.523–19.81 µm (aerodynamic diameter).
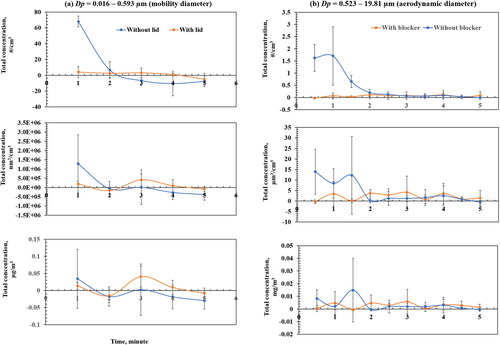
Figure 4. Baseline corrected particle size distributions (0.016–0.593 µm) measured by Scanning Mobility Particle Sizer in three metrics (number, surface area, and mass) during the first 60 sec after flushing.
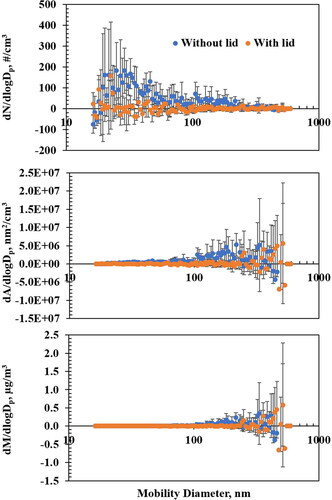
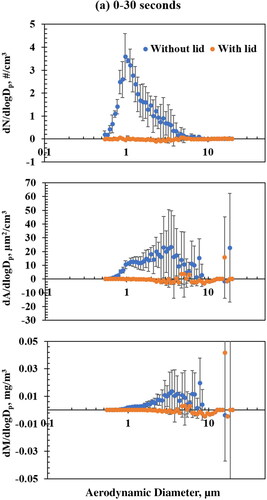
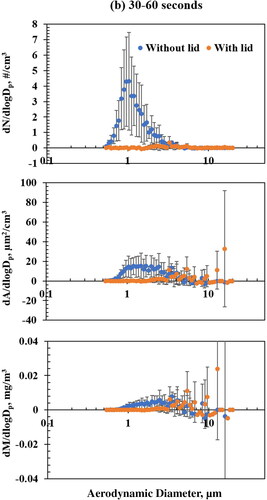

Figure 6. Particle concentration reduction by size: (a) 0.016–0.593 µm measured by Scanning Mobility Particle Sizer and (b) 0.523–19.81 µm measured by Aerodynamic Particle Sizer.
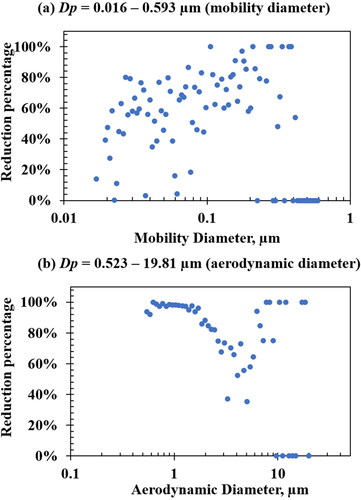
Figure 7. Large particle movement captured by the high-speed camera.
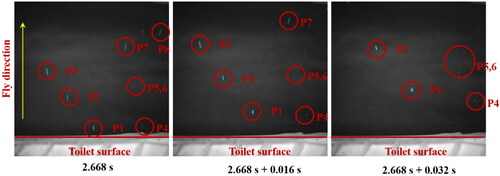
Table 1. Fluorescein concentrations deposited on the lid.
Data availability
The laboratory data are available upon reasonable request to Dr. Changjie Cai and Dr. Yingtao Liu.