
Figures & data
Figure 1. Map of Vietnam with the Can Tho province marked in dark blue (left) Thoi Lai District, with the three study communes Trường Xuân, Trường Xuân B, and Thới Tân (right).
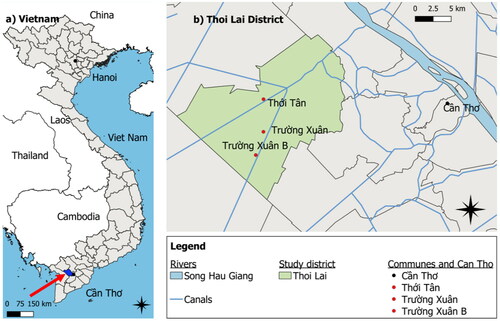
Table 1. Agricultural educational interventions identified as official educational programs in this study.
Table 2. Study population overview depicting mean with the standard deviation (SD) and percentage of participants.
Table 3. Pesticides investigated by the surveyTable Footnote*.
Figure 2. Access and use of specific PPE not related to sun protection.
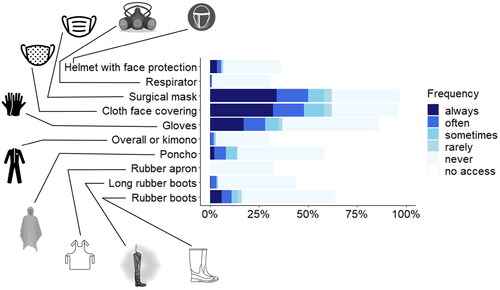
Table 4. Latent classes derived from the latent class analysis for knowledge and practices.
Table 5. Mutually adjusted associations of demographics and farming specific factors with pesticide safety knowledge (high vs. low)Table Footnote*.
Table 6. Mutually adjusted associations of pesticide safety knowledge with pesticide practice (intermediate vs. unsafe and good vs. unsafe)Table Footnote*.
Supplemental Material
Download PDF (588.9 KB)Data availability statement
The data that support the findings of this study are available in an anonymized form from the corresponding author [AG] upon reasonable request.