
Figures & data
Figure 1. (A) View from side on subject. (B) Expanded view. (C) Probed respirator.
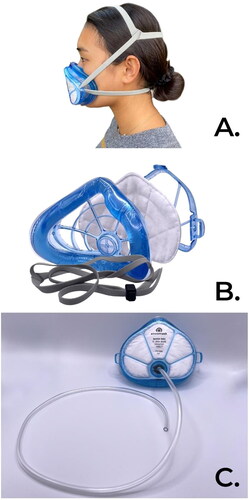
Table 1. Simulated workplace activities and sampling time.
Figure 2. NIOSH bivariate panel with subject number and facial dimensions.
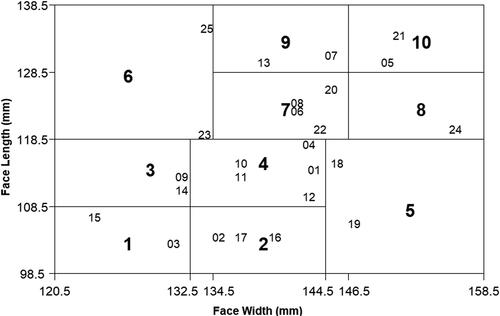
Figure 3. Comparison of fit factors (FF95) and overall truncated simulated workplace protection factors (SWPF). Dotted line indicates a 1 to 1 correlation.
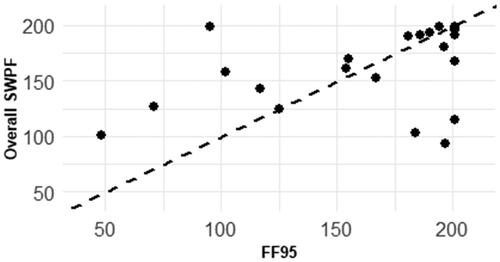
Table 2. Summary statistics – it actor (FF) in N95 mode, simulated sorkplace protection factor (SWPF) with truncated and non-truncated data.
Data availability
The data that support the findings of this study are available from the corresponding author, MS, upon reasonable request.