
Figures & data
Table 1. Self-reported participant demographic information (N = 88).
Table 2. Concentration of PAHs in personal air samples (N = 27) collected during fire training activities (in μg/m3).
Figure 1. Boxplots illustrating osmolality-corrected urinary concentrations of (A) 1-hydroxypyrene, (B) Ʃhydroxyphenanthrenes, (C) Ʃhydroxyfluorenes, and (D) Ʃhydroxynaphthalenes in firefighters before live fire training (pre-fire) and after live fire training (post-fire). The box limits represent the interquartile range (i.e., 25th to 75th percentile), the diamonds represent the mean value, the solid line represents the group median, and the whiskers extend to the 5th and 95th percentiles. The asterisks (***) indicate a significant difference between pre- and post-fire levels at p < 0.0001 using a paired t test.
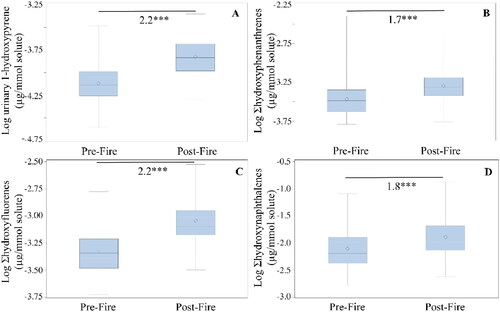
Table 3. Fold-change decreases post-decontamination compared to post-fire in PAHs on skin surface samples (N = 22).
Table 4. Calculation of absorption time for parent PAHs of the urinary metabolites measured.
Supplemental Material
Download MS Word (179.3 KB)Data availability statement
Data are not publicly available due to the privacy of the human participants involved.