
Figures & data
Figure 1. Floor plan of the FDM02 3D printing workplace.
The gray circles and the triangles represent the different types of 3D printers. The light-gray shapes represent operating printers, and the dark-gray shapes represent nonoperating printers. The numbers 1 to 5 indicate the sampling points. The sampling time for sampling point 1 was 2 hr, and those for sampling points 2, 3, 4, and 5 were 12 min. The timelines for the sampling points are shown in .
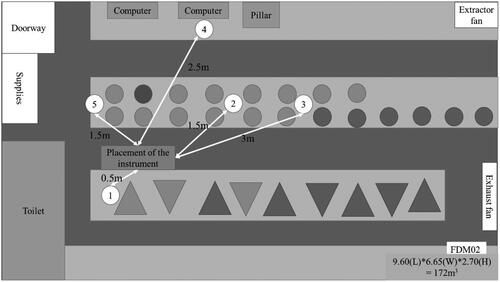
Table 1. Specifications of the studied 3-D printers and print conditions.
Figure 2. Experimental setup for 3D printing in occupational settings.
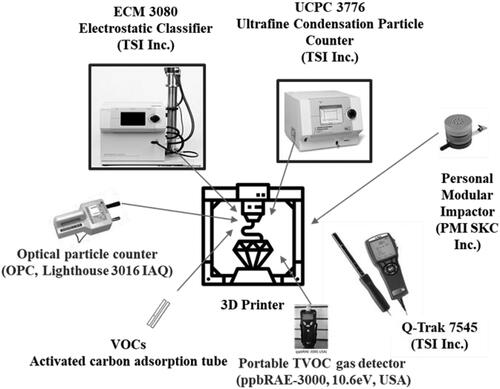
Table 2. Estimation of particulate matter and TVOCs during 3D printing in occupational workplaces.
Figure 3. Temporal submicron-particle size distribution for FDM01.
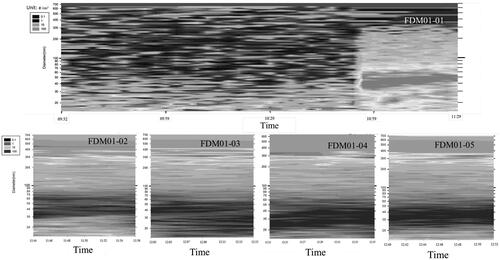
Figure 4. Temporal submicron-particle size distribution for FDM03.
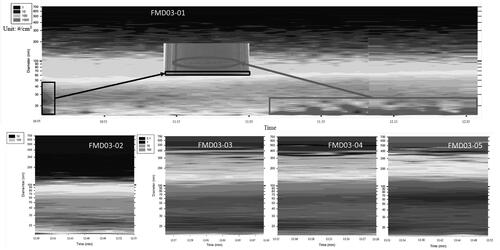
Figure 5. Temporal submicron-particle size distribution for LCD01.
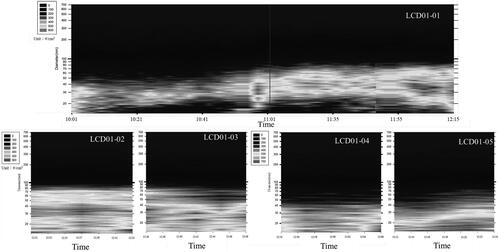
Figure 6. Temporal submicron-particle size distribution for SLA01.
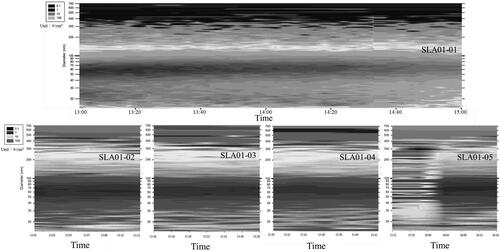
Figure 7. Temporal submicron-particle size distribution for BJ01.
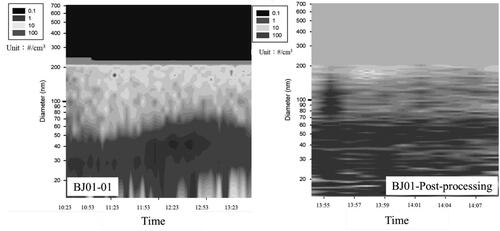
Figure 8. Temporal PM concentration variation for FDM01 at the workplace.
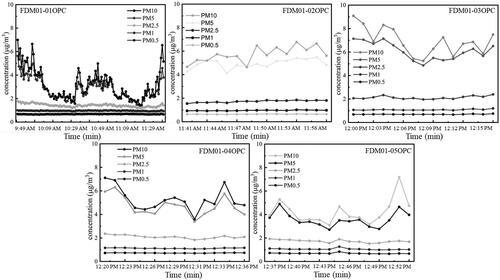
Figure 9. Temporal PM concentration variation for FDM02 at the workplace.
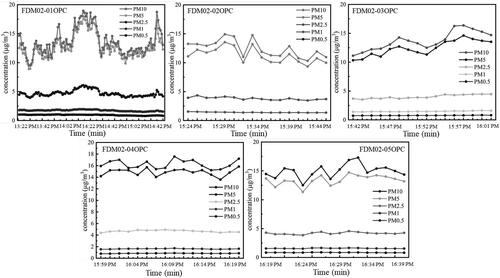
Figure 10. Temporal PM concentration variation for FDM03 at the workplace.
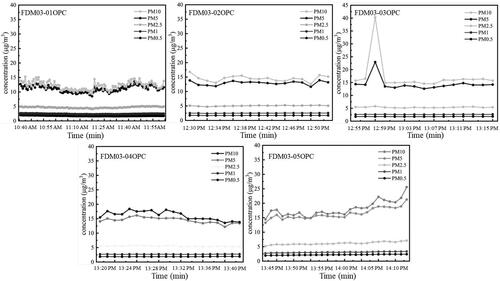
Figure 11. Temporal PM concentration variation for FDM04 at the workplace.
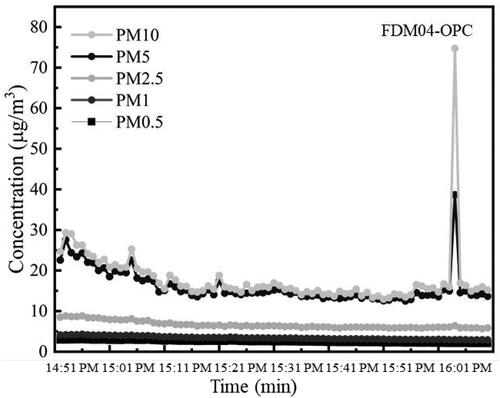
Figure 12. Temporal PM concentration variation for FDM05 at the workplace.
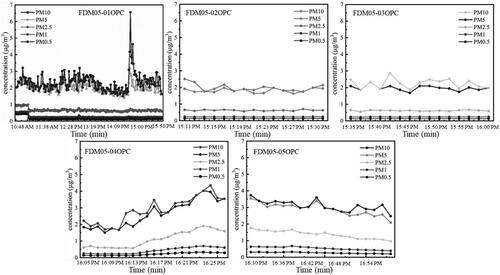
Figure 13. Temporal PM concentration variation for FDMO6 at the workplace.
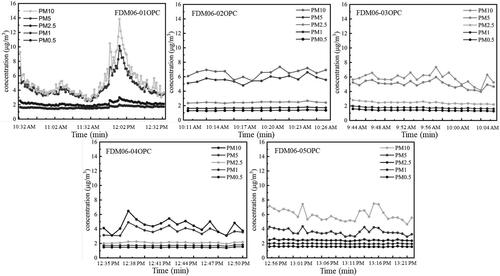
Figure 14. Temporal PM concentration variation for LCD01 at the workplace.
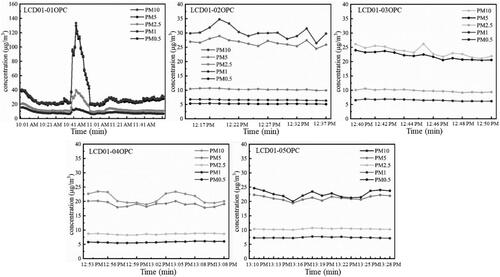
Figure 15. Temporal PM concentration variation for SLA01 at the workplace.
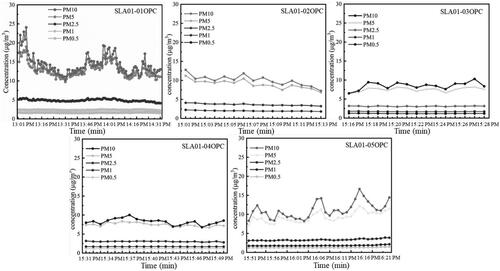
Figure 16. Temporal PM concentration variation for BJ01 at the workplace.
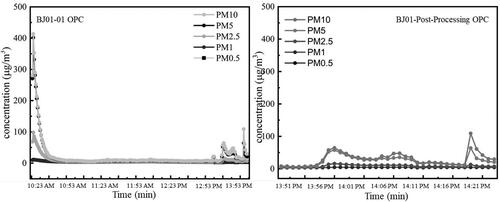
Table 3. Detection of VOCs during 3D printing in occupational settings.
Supplemental Material
Download MS Word (10.6 MB)Data availability
Data will be provided by the authors upon request.