
Figures & data
Table 1. Descriptive statistics.
Figure 1. Histogram of conference fees in 2020–2021.
Note: Conference fees exceeding USD 400 are censured for a better graphical display. The curve shows the normal density curve. Source: Websites of the conferences listed in http://www.atlas-euro.org/events.aspx.
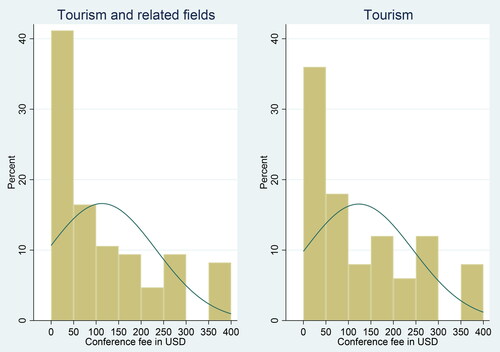
Table 2. Conference fees by attributes.
Table 3. Determinants of fees for virtual conferences, PPML estimations (tourism and related fields).
Table 4. Determinants of fees for virtual conferences, PPML estimations (tourism).
Table A1. Lists of virtual conferences.