
Figures & data
Figure 1. Schematic diagram of scene building.
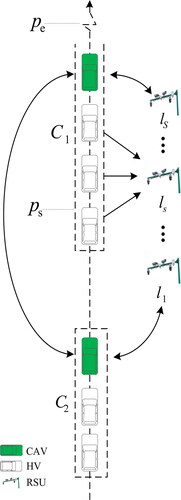
Figure 2. Traffic information to be obtained.
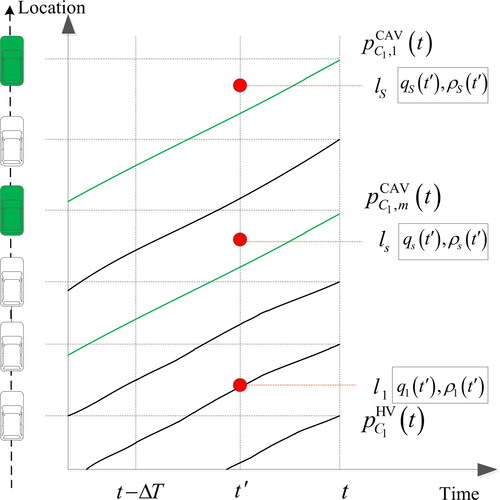
Figure 3. Schematic diagram of trajectory offset.
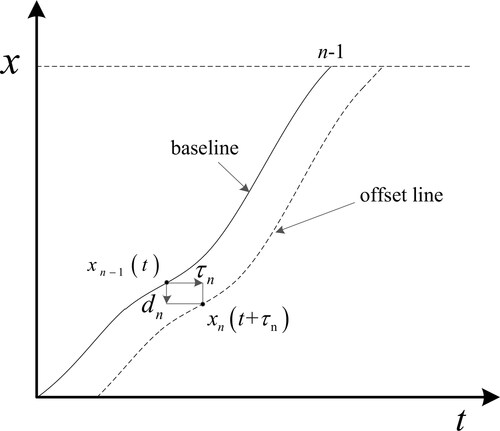
Figure 4. Correction of offset trajectory near
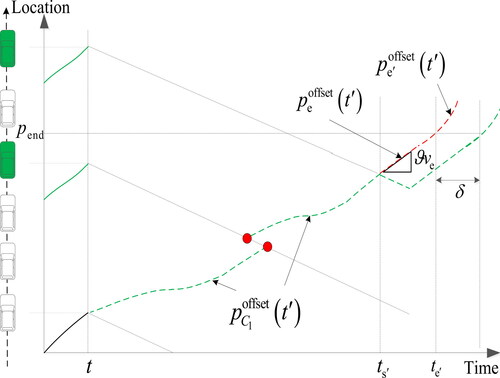
Figure 5. Triangular fundamental diagrams.
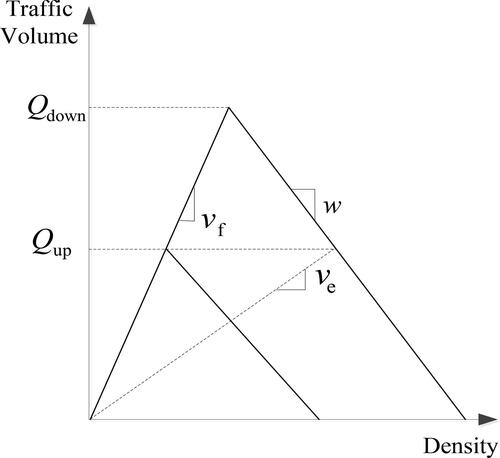
Table 1. Comparison of dissipation time under different conditions.
Figure 6. Connection merging points.
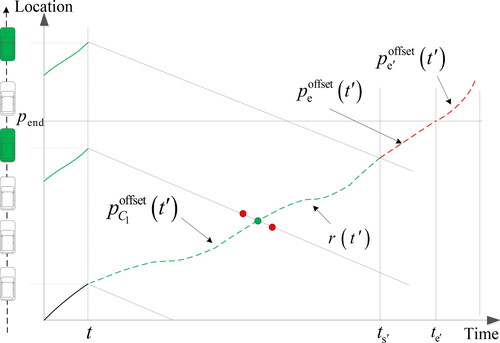
Figure 7. Modified offset trajectory.
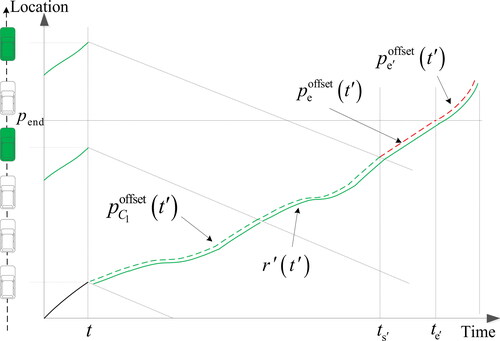
Figure 8. The first speed of CAV guidance process of the upstream vehicle cluster.
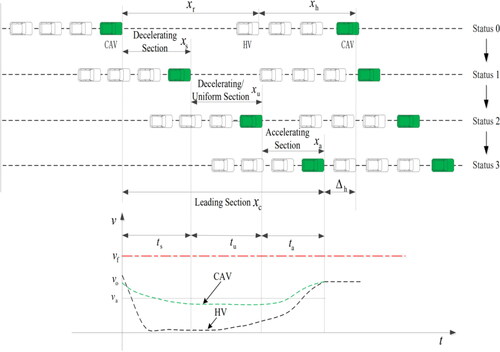
Figure 9. Deceleration curves.
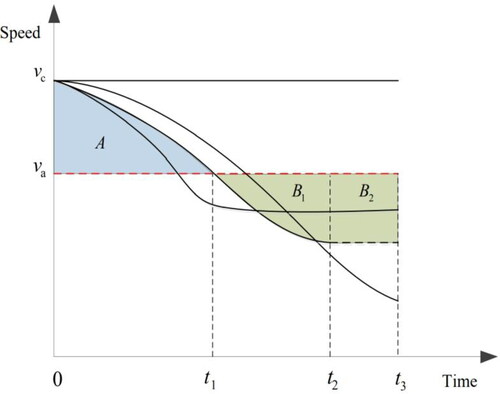
Figure 10. Acceleration curves.
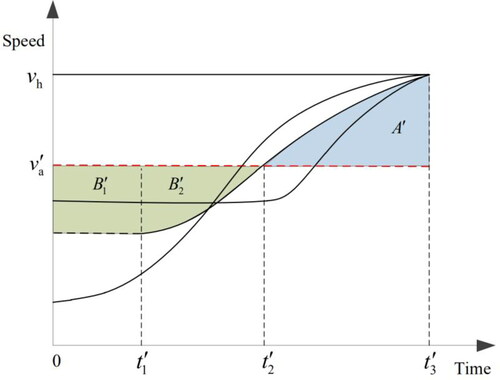
Figure 11. Simulation results under different conditions.
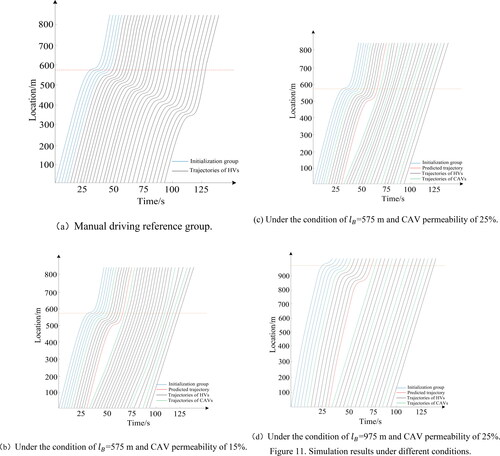
Figure 12. Several different speed guide curves.
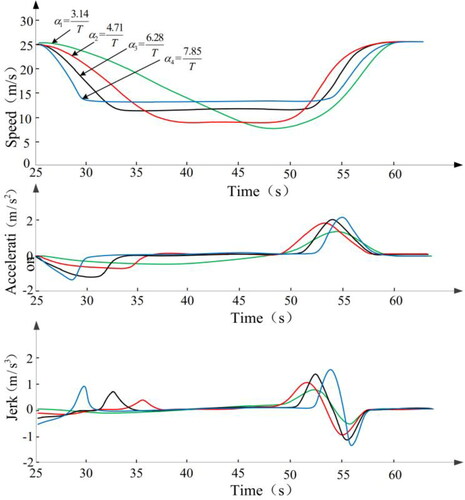
Table 2. The time of the last vehicle to reach the same position under different CAV permeability.
Table 3. Acceleration of the first CAV at different time corresponding to different values.
Data availability statement
The data used to support the findings of this study are available from the corresponding author upon request.