Figures & data
Figure 1. Shift of Lane Directions in DLR. (a) Initial lane configuration. (b). Lane configuration in the next time interval.
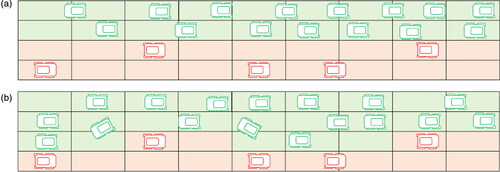
Figure 2. Traffic flow in the CTM.
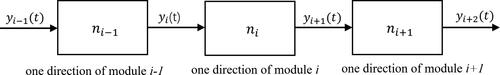
Table 1. Correction coefficients.
Figure 3. Proxy model of DLR in VISSIM.
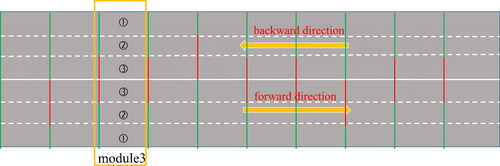
Table 2. Default and recommended values of sensitive parameters.
Table 3. Parameters in the NSGA-II algorithm.
Figure 4. Pareto-optimal solutions in various cases.
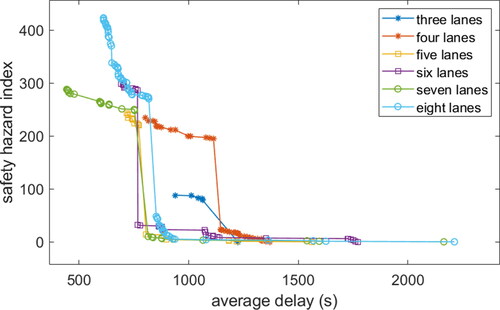
Table 4. Direction inflow rate for different lane conditions.
Figure 5. Comparison of delays obtained in VISSIM and CTM.
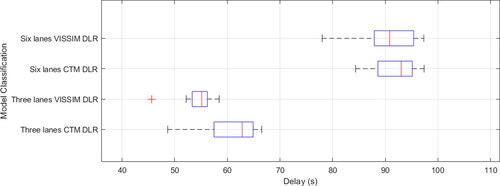
Table 5. Result of regression parameter estimates.
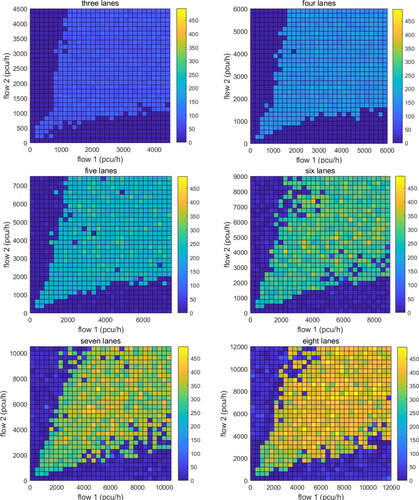
Figure 6. Average vehicle delay reduction (s) vs. directional flow (pcu/h).
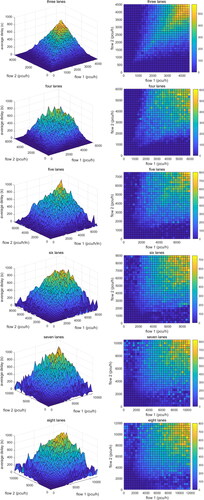
Figure 7. Average vehicle delay reduction (s) vs. directional flow (pcu/h) in a situation with four lanes.
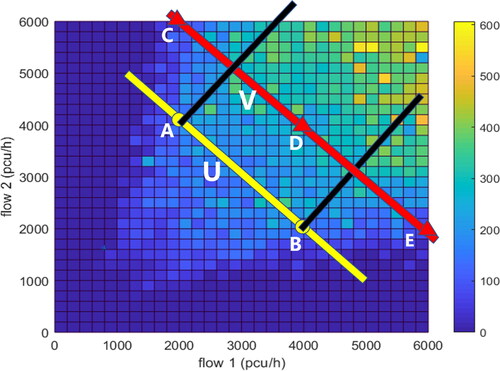
Figure 8. Driving safety hazard index vs. directional flow (pcu/h).