Figures & data
Table 1. Comparative summary of related literature on ADR operation optimization problem.
Figure 1. Business-as-usual delivery scheme.
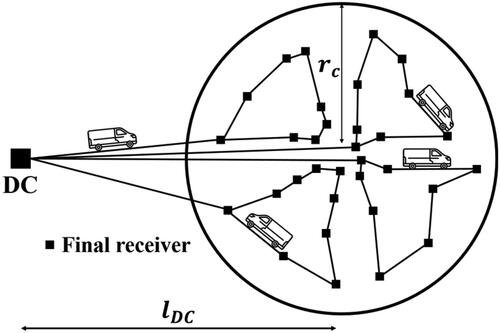
Figure 2. Two-echelon delivery scheme.
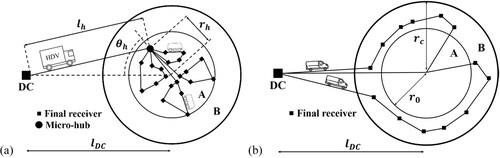
Table 2. Logistics key performance indicator notations.
Figure 3. Small and medium European cities considered in the sample.
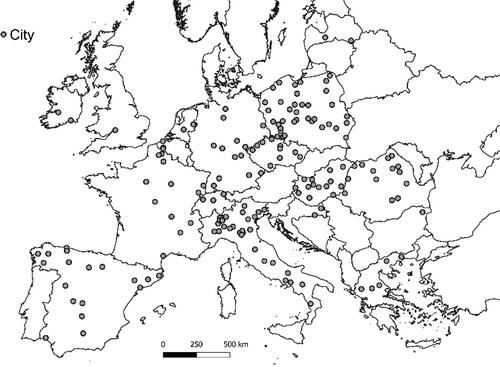
Figure 4. (a) City population PDF and (b) city area PDF, per country.
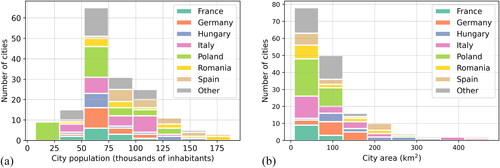
Figure 5. Carrier demand spatial PDF. Examples in different European cities.
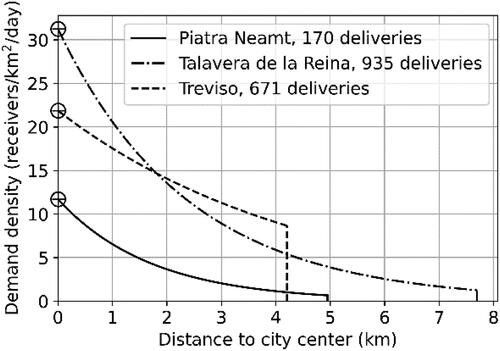
Figure 6. Micro-hub unit area daily infrastructure cost as a function of distance to city center. Examples in different European cities.
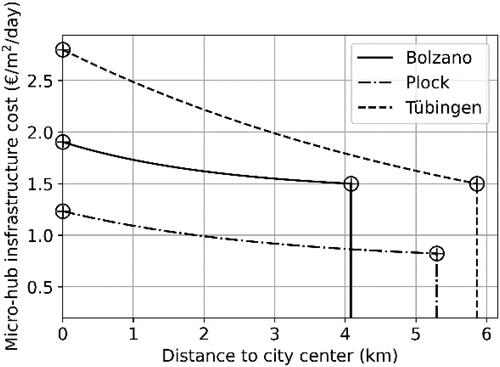
Table 3. Parameter and cost assumptions.
Table 4. Line-haul and local driving cycles.
Figure 7. Operation delivery cost ratio as a function of micro-hub delivery zone radius
and distance
between the logistics micro-hub and city center in Roanne.
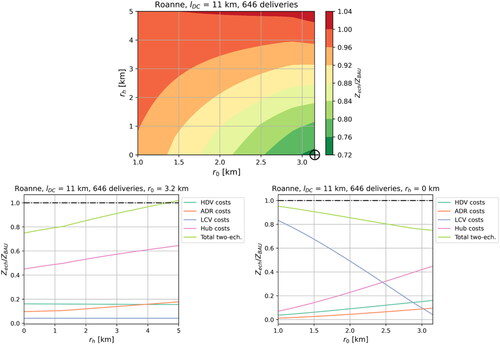
Figure 8. Operation delivery cost ratio as a function of micro-hub delivery zone radius
and distance
between the logistics micro-hub and city center in Legnica.
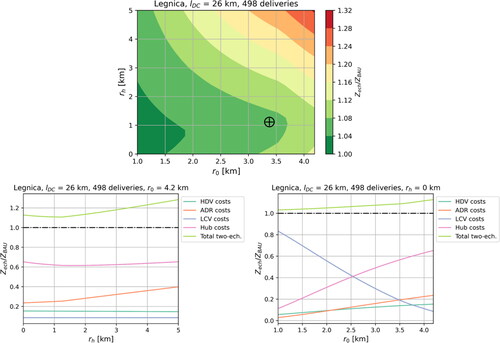
Figure 9. Operation delivery cost ratio as a function of micro-hub delivery zone radius
and distance
between the logistics micro-hub and city center in Potenza.
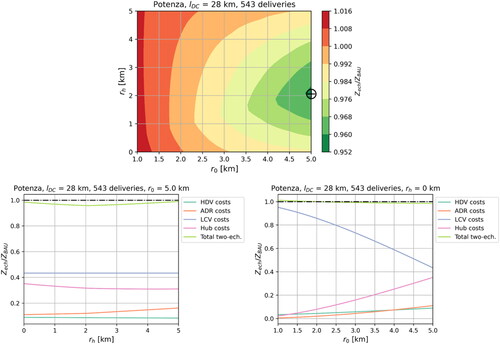
Figure 10. Decomposition of the optimized delivery cost ratio per vehicle type and micro-hub contribution for several cities.
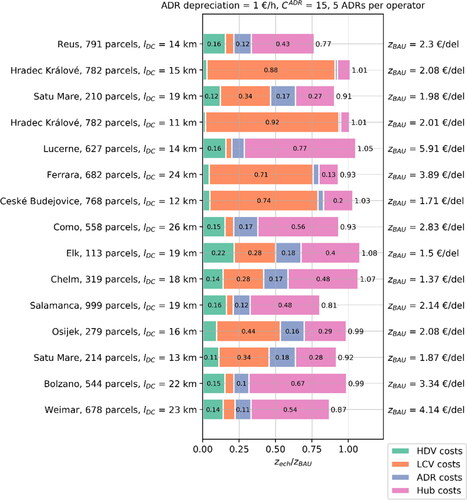
Figure 11. Optimized delivery cost ratio as a function of the line-haul distance
for several cities.
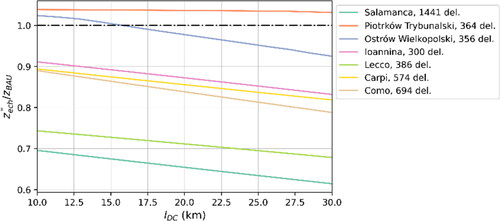
Figure 12. Histogram of cost ratio as a function of (a) micro-hub infrastructure/personnel cost ratio
(b) demand density
(c) distribution center distance/city radius ratio
(d) city area
(e) personnel cost/ADR depreciation ratio
and (f) total number of deliveries
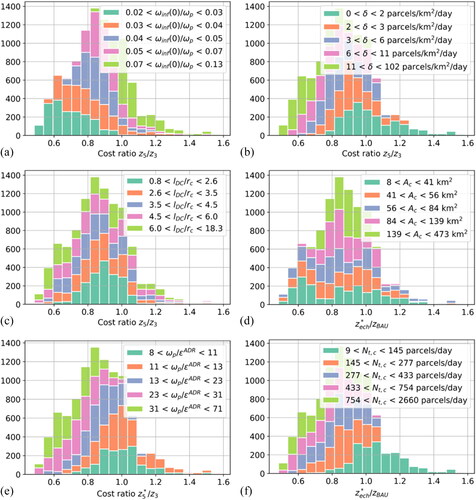
Figure 13. (a) Two-echelon mean operation costs per parcel delivery, (b) operation costs variation when implementing two-echelon delivery scheme, and (c) probability of obtaining lower two-echelon operations costs
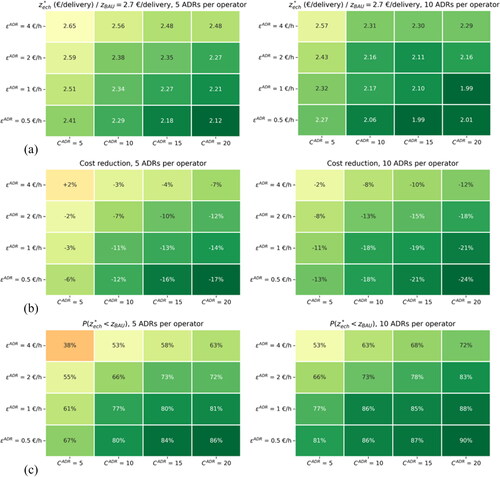
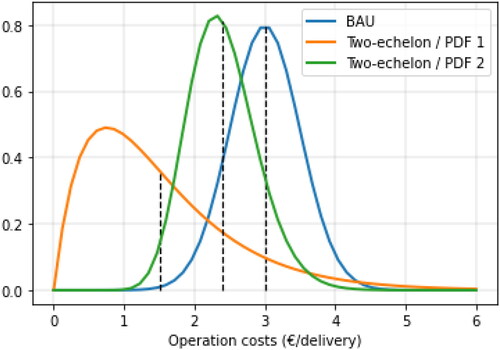
Figure 14. Hypothetical two-echelon operation PDFs.