
Figures & data
Figure 1. The conceptual model.
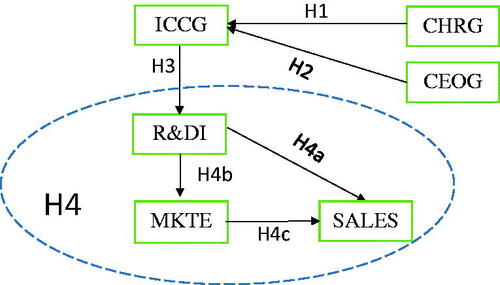
Table 1. Exogenous and endogenous variables.
Figure 2. Structural model assessment procedure.
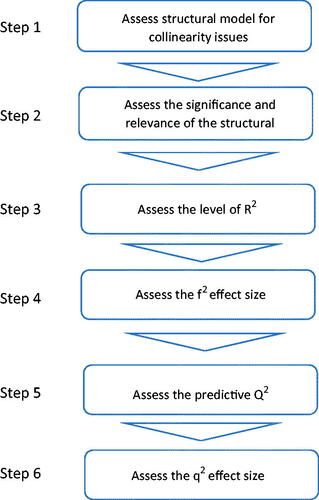
Table 2. Descriptive statistics and correlation coefficient matrix (N = 305).
Figure 3. Estimated path coefficients of the conceptual model.
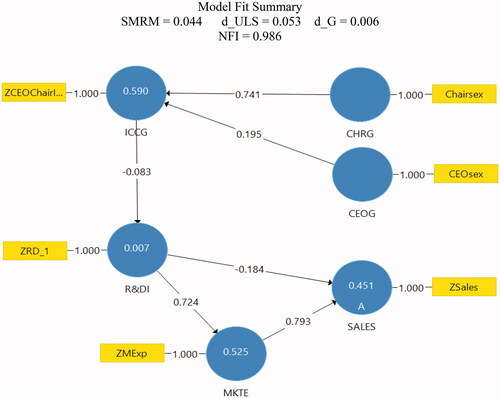
Table 3. Mediation analysis using PLS-SEM.
Table 4. Results of hypotheses testing.
Table 5. Total effects of the model.
Table 6. Specific indirect effects.
Table 7. Two-sample cross-validation.
Table 8. f Square endogenous variables.
Table 9. Q2 values for predictive relevance.
Table 10. q2 effect size for relative predictive relevance.