1,743
Views
40
CrossRef citations to date
0
Altmetric
Research Paper

Vascular replacement using a layered elastin-collagen vascular graft in a porcine model: one week patency versus one month occlusion

, , , , , , & show all
Pages 105-121 | Received 13 Jan 2015, Accepted 01 Apr 2015, Published online: 30 Jun 2015

Figures & data

Figure 1. Macroscopic view and scanning electron micrographs of the triple-layered natural graft and the control graft Propaten (ePTFE). (A) macroscopic view. (B-C) cross-sections, (D-E) luminal surface morphology. The natural graft displays a 3 layered architecture with an inner elastin layer (B-1), an intermediate porous/lamellar type I collagen film for strength (B-2) and a porous outer type I collagen layer (B-3). In the PTFE graft the wall (C-1) and the supporting ring (C-2) are seen. Scanning electron microscopy reveals differences in wall thicknesses and porosity between both grafts. Luminal lining of the natural graft consists of elastin fibers (D), whereas the ePTFE graft displays lamellae with perpendicular struts (E). Bars represent 100 µm (B-C) and 10 µm (D-E). L: lumen.
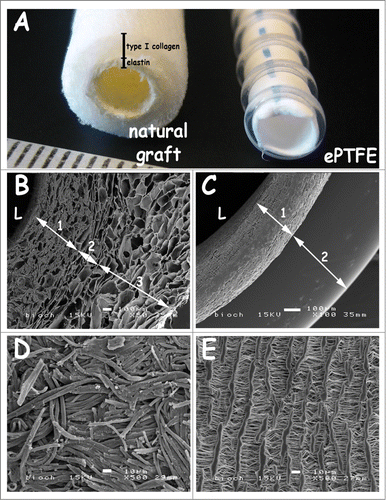
Figure 1. Macroscopic view and scanning electron micrographs of the triple-layered natural graft and the control graft Propaten (ePTFE). (A) macroscopic view. (B-C) cross-sections, (D-E) luminal surface morphology. The natural graft displays a 3 layered architecture with an inner elastin layer (B-1), an intermediate porous/lamellar type I collagen film for strength (B-2) and a porous outer type I collagen layer (B-3). In the PTFE graft the wall (C-1) and the supporting ring (C-2) are seen. Scanning electron microscopy reveals differences in wall thicknesses and porosity between both grafts. Luminal lining of the natural graft consists of elastin fibers (D), whereas the ePTFE graft displays lamellae with perpendicular struts (E). Bars represent 100 µm (B-C) and 10 µm (D-E). L: lumen.

Figure 2. Overview of the surgical procedure. (A) The iliac artery freed from adherent tissue. (B) Suturing of the natural graft proximally with running sutures. (C) Anastomised graft with running sutures. (D) Interpositioned graft after clamp removal, and Surgicel® placement. Please note resumed blood flow in supplemental movie. (E) Interpositioned ePTFE (Propaten) used as control graft. p: proximal, d: distal.
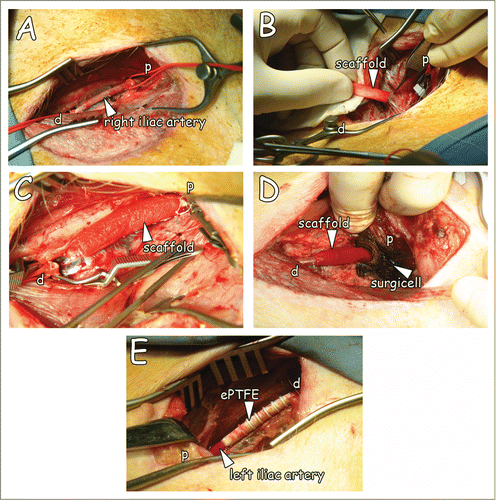
Figure 2. Overview of the surgical procedure. (A) The iliac artery freed from adherent tissue. (B) Suturing of the natural graft proximally with running sutures. (C) Anastomised graft with running sutures. (D) Interpositioned graft after clamp removal, and Surgicel® placement. Please note resumed blood flow in supplemental movie. (E) Interpositioned ePTFE (Propaten) used as control graft. p: proximal, d: distal.

Figure 3. Representative duplex scannings from day 0, week 1 and week 4 of the natural and ePTFE graft (left and right column, respectively). Both grafts were open 1 week after surgery (A-D). The natural grafts (4/4) and one ePTFE (1/4) were occluded 4 weeks after surgery (E-F, white arrow, occluded natural graft and open ePTFE). In some cases, the view at day 0 was blocked due to placement of Surgicel®, recognized by black shading (B, white arrow). Measurements were performed proximally (A, B), within the graft (C, D) and distally (E, F). Quantitative values are listed in .
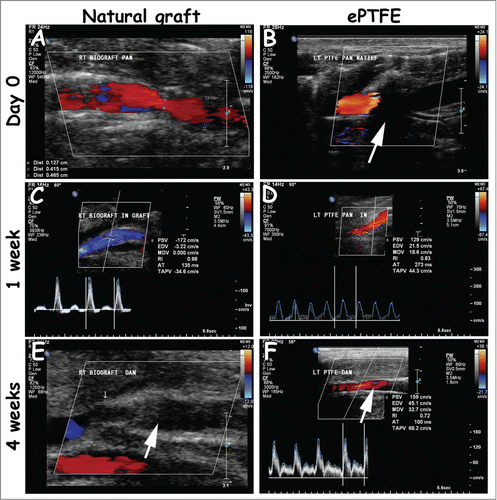
Figure 3. Representative duplex scannings from day 0, week 1 and week 4 of the natural and ePTFE graft (left and right column, respectively). Both grafts were open 1 week after surgery (A-D). The natural grafts (4/4) and one ePTFE (1/4) were occluded 4 weeks after surgery (E-F, white arrow, occluded natural graft and open ePTFE). In some cases, the view at day 0 was blocked due to placement of Surgicel®, recognized by black shading (B, white arrow). Measurements were performed proximally (A, B), within the graft (C, D) and distally (E, F). Quantitative values are listed in Table 1.

Table 1. Duplex scanning measurements of blood velocities in natural graft and ePTFE interposed in iliac arteries. The constructed natural graft was placed in the right iliac artery and the control graft Propaten (ePTFE) in the left iliac artery. Peak systolic velocities (PSV) were measured (cm/s) in the native proximal and distal artery. Additionally, velocity was measured in both anastomoses and within the graft itself. In some cases, velocity measurements performed directly after surgery (day 0) were hindered by the placement of Surgicel® and were scored n.d. for not determined. Normal PSV amounts to 100 cm/s.

Figure 4. Macroscopic view of explants one week after surgery. Both natural and ePTFE graft were excised with surrounding tissue. Lumens were free for passage (white arrowheads). Anastomoses are indicated by dotted lines. Bar represents 1 cm.
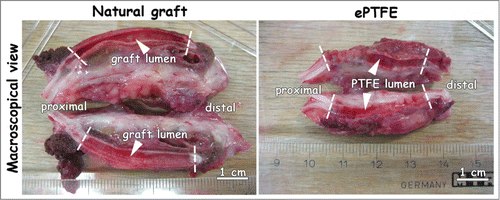
Figure 4. Macroscopic view of explants one week after surgery. Both natural and ePTFE graft were excised with surrounding tissue. Lumens were free for passage (white arrowheads). Anastomoses are indicated by dotted lines. Bar represents 1 cm.

Figure 5. Histological images from distal anastomoses 1 week after surgery. Distinct anastomotic sites and patent grafts are visible. The natural graft's elastin layer is shown in black/blue (C, E). Please note continuity between elastin layering of the natural graft and elastin of the native vessel (E). Lamellae of the type I collagen film are seen in pink (A, C) and green (E), and indicated by asterisks (*). (A-B) H&E staining. (C-D) Elastin von Gieson staining (collagen: pink, elastin: blue/black). (E-F) Elastin Masson Trichrome staining (collagen: green, elastin: black, red: fibrin, cells). Dotted lines indicate anastomoses. Bar represents 200 µm.
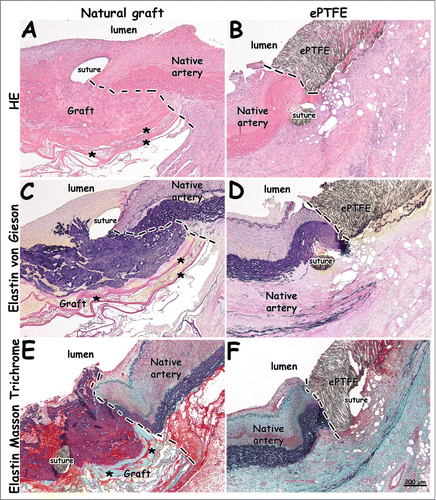
Figure 5. Histological images from distal anastomoses 1 week after surgery. Distinct anastomotic sites and patent grafts are visible. The natural graft's elastin layer is shown in black/blue (C, E). Please note continuity between elastin layering of the natural graft and elastin of the native vessel (E). Lamellae of the type I collagen film are seen in pink (A, C) and green (E), and indicated by asterisks (*). (A-B) H&E staining. (C-D) Elastin von Gieson staining (collagen: pink, elastin: blue/black). (E-F) Elastin Masson Trichrome staining (collagen: green, elastin: black, red: fibrin, cells). Dotted lines indicate anastomoses. Bar represents 200 µm.

Figure 6. Histological images 4 weeks after surgery. Natural grafts show occlusion with layered thrombi characterized by lines of Zahn (A, C). One ePTFE graft was found to be occluded (B). Calcification was seen in the natural graft located in the elastin layer (C, D, alizarin red staining). Bar represents 200 µm.
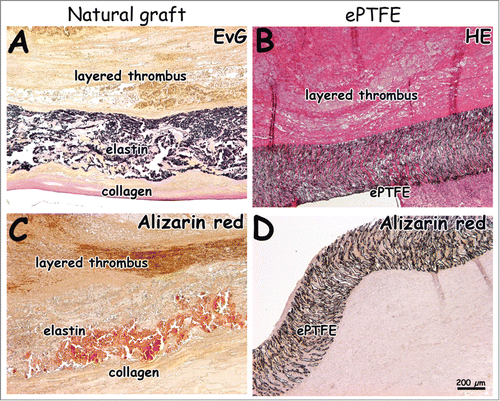
Figure 6. Histological images 4 weeks after surgery. Natural grafts show occlusion with layered thrombi characterized by lines of Zahn (A, C). One ePTFE graft was found to be occluded (B). Calcification was seen in the natural graft located in the elastin layer (C, D, alizarin red staining). Bar represents 200 µm.

Figure 7. Immunohistochemical images of explants 1 week after surgery (patent lumens). Staining for smooth muscle actin (A, B), laminin (C, D), factor VIII (E, F) and VWF (G, H). Surrounding tissue has invaded the outer collagen layer of the natural graft (A). Endothelial cells on a laminin-positive layer (C, D). Endothelial cells positive for VWF and factor VIII (E-H). VWF-rich depots in the collagen porous film (insert E). Arrows indicate positive staining (C-E), and dotted lines indicate boundary between collagen scaffold and surrounding tissue (A), and anastomosis (B, distal). Bars present 200 µm (A-F) and 50 µm (G, H, and insert of E).
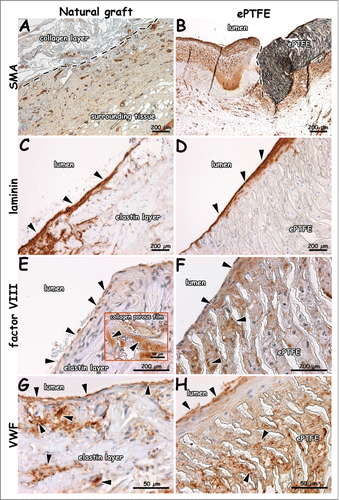
Figure 7. Immunohistochemical images of explants 1 week after surgery (patent lumens). Staining for smooth muscle actin (A, B), laminin (C, D), factor VIII (E, F) and VWF (G, H). Surrounding tissue has invaded the outer collagen layer of the natural graft (A). Endothelial cells on a laminin-positive layer (C, D). Endothelial cells positive for VWF and factor VIII (E-H). VWF-rich depots in the collagen porous film (insert E). Arrows indicate positive staining (C-E), and dotted lines indicate boundary between collagen scaffold and surrounding tissue (A), and anastomosis (B, distal). Bars present 200 µm (A-F) and 50 µm (G, H, and insert of E).

Reprints and Corporate Permissions

Please note: Selecting permissions does not provide access to the full text of the article, please see our help page How do I view content?

To request a reprint or corporate permissions for this article, please click on the relevant link below:

Academic Permissions

Please note: Selecting permissions does not provide access to the full text of the article, please see our help page How do I view content?

Obtain permissions instantly via Rightslink by clicking on the button below:

If you are unable to obtain permissions via Rightslink, please complete and submit this Permissions form. For more information, please visit our Permissions help page.