1,282
Views
18
CrossRef citations to date
0
Altmetric
RESEARCH PAPERS

Repurposed biological scaffolds: kidney to pancreas

, , , , , , , , , & show all
Pages 47-57 | Received 06 Mar 2015, Accepted 25 Jun 2015, Published online: 07 Aug 2015

Figures & data

Figure 1. Pig kidneys pre- and post-decellularization and collagen-IV staining of glomerular structures. Gross image of pig kidney pre- (A) and post-decellularization (B), scale bar 1 cm. Collagen-IV immunohistochemical staining of basement membranes (C–H). Pig kidney histology before decellularization (C–E) and after (F–H); arrow heads point to acellular glomerular vascular tufts (G,H). Scale bar (C–H) 100 μm.
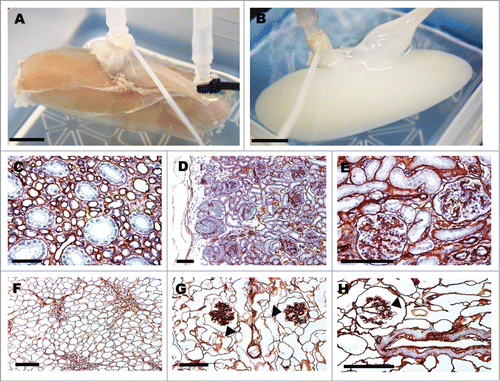
Figure 1. Pig kidneys pre- and post-decellularization and collagen-IV staining of glomerular structures. Gross image of pig kidney pre- (A) and post-decellularization (B), scale bar 1 cm. Collagen-IV immunohistochemical staining of basement membranes (C–H). Pig kidney histology before decellularization (C–E) and after (F–H); arrow heads point to acellular glomerular vascular tufts (G,H). Scale bar (C–H) 100 μm.

Figure 2. Fluorescent 10 μm polystyrene microspheres (FluoSpheres®) with antegrade perfusion in renal artery (red), (A) visualizing afferent arteriole and glomerulus and retrograde perfusion in ureter (green), (B). Scale bar (A, B) 1 cm. Ten μm polystyrene FluoSpheres® (arrowhead) injected retrograde in the ureter and reaching Bowman's space. Scale bar (C, D) 50 μm.
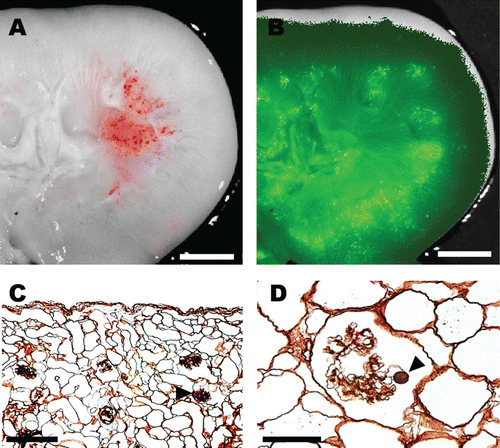
Figure 2. Fluorescent 10 μm polystyrene microspheres (FluoSpheres®) with antegrade perfusion in renal artery (red), (A) visualizing afferent arteriole and glomerulus and retrograde perfusion in ureter (green), (B). Scale bar (A, B) 1 cm. Ten μm polystyrene FluoSpheres® (arrowhead) injected retrograde in the ureter and reaching Bowman's space. Scale bar (C, D) 50 μm.

Figure 3. Three-day incubation of scaffold showing antegrade seeding of vasculature and retrograde seeding of collecting system. H&E (A). GFP+ cells line peritubular capillary vessels (B–D) while a GFP βTC-tet cell population (D) occupy tubular structures. GFP+ cells are marked by arrows and the GFP βTC-tet cells with arrowheads (B–D). Scale bar 100 μm.

Figure 3. Three-day incubation of scaffold showing antegrade seeding of vasculature and retrograde seeding of collecting system. H&E (A). GFP+ cells line peritubular capillary vessels (B–D) while a GFP− βTC-tet cell population (D) occupy tubular structures. GFP+ cells are marked by arrows and the GFP− βTC-tet cells with arrowheads (B–D). Scale bar 100 μm.
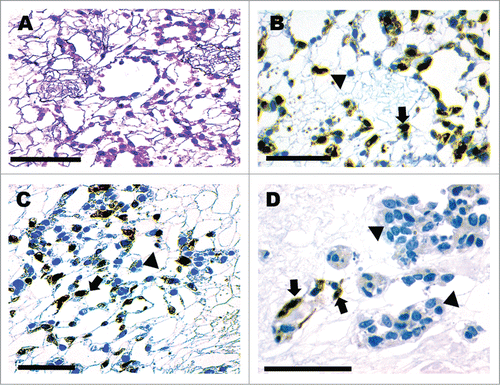
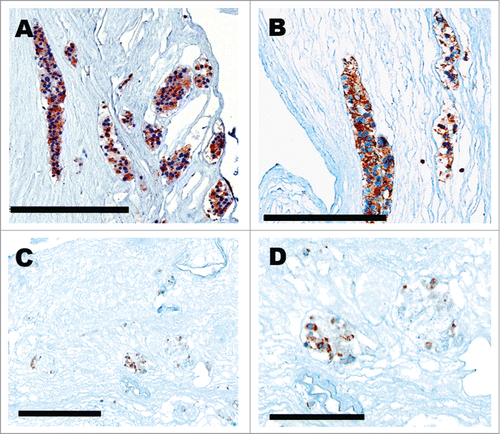
Figure 4. 3-day incubation of scaffold after retrograde seeding of pancreatic β cells. Cells showing positive insulin immunoreactivity localized to the collecting tubules (A, B) and glomeruli (C, D). Scale bar 200 μm (A–C) 100 μm (D).

Figure 4. 3-day incubation of scaffold after retrograde seeding of pancreatic β cells. Cells showing positive insulin immunoreactivity localized to the collecting tubules (A, B) and glomeruli (C, D). Scale bar 200 μm (A–C) 100 μm (D).

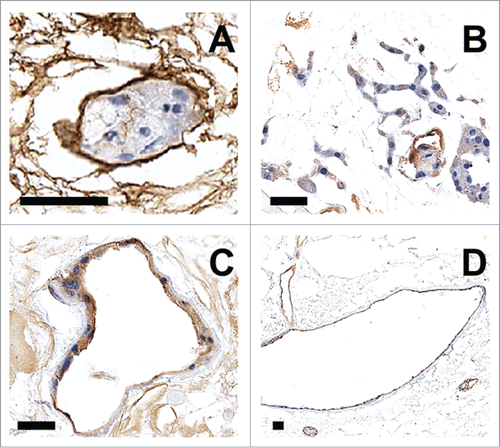
Figure 5. (A) Collagen IV immunohistochemical staining of glomerular tuft containing EOMA cells. (B–D) CD31 immunohistochemical staining of EOMA cells lining blood vessels. Scale bar = 50 μM.

Figure 5. (A) Collagen IV immunohistochemical staining of glomerular tuft containing EOMA cells. (B–D) CD31 immunohistochemical staining of EOMA cells lining blood vessels. Scale bar = 50 μM.

Reprints and Corporate Permissions

Please note: Selecting permissions does not provide access to the full text of the article, please see our help page How do I view content?

To request a reprint or corporate permissions for this article, please click on the relevant link below:

Academic Permissions

Please note: Selecting permissions does not provide access to the full text of the article, please see our help page How do I view content?

Obtain permissions instantly via Rightslink by clicking on the button below:

If you are unable to obtain permissions via Rightslink, please complete and submit this Permissions form. For more information, please visit our Permissions help page.