
Figures & data
FIGURE 1. Digital subtraction angiography images of the porcine iliac arteries before stent implantation (A), immediately after stent implantation (B) and 6 weeks after stent implantation (C). The Igaki-Tamai stent was placed in the right iliac artery, and a bare metal stent was placed in the left iliac artery. Each arrow shows an edge of the implanted stents.
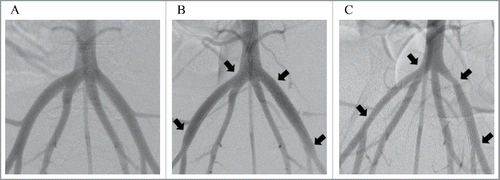
TABLE 1. Comparison of the results of intravascular ultrasound analysis between Igaki-Tamai stents (ITSs) and bare metal stents (BMSs).
FIGURE 2. Intravascular images of the vessels before stent implantation (A), implanted with Igaki-Tamai stents (B, C) and bare metal stents (D, E) immediately after stent implantation (B, D) and 6 weeks after stent implantation (C, E).
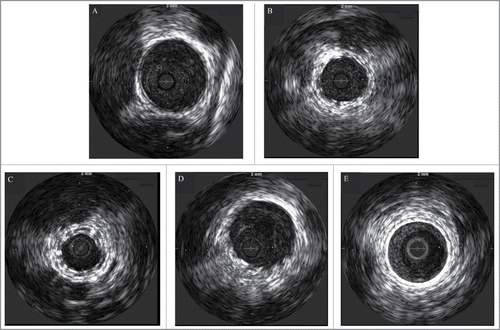
FIGURE 3. Graph A shows percent vessel lumen change with Igaki-Tamai stents (ITSs) and bare metal stents (BMSs). Graph B shows percent area stenosis with ITSs and BMSs at 6-week follow-up. Graph C shows vascular remodeling with ITSs and BMSs at 6-week follow-up.
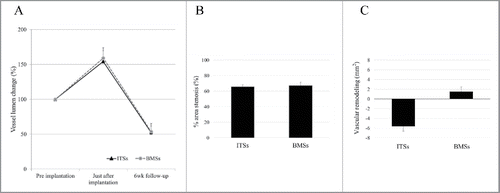
TABLE 2. Comparison of the results of histomorphometric analysis between Igaki-Tamai stents (ITSs) and bare metal stents (BMSs) at 6 weeks after stent implantation.
FIGURE 4. Representative photomicrographs of hematoxylin-eosin-stained sections of the porcine iliac arteries 6 weeks after stent implantation. (A) Igaki-Tamai stent. (B) Bare metal stent. (C) Non-stented segment.
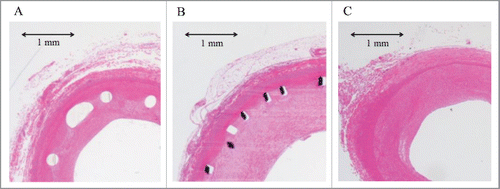
TABLE 3. Comparison of the results of histopathological analysis between Igaki-Tamai stents (ITSs) and bare metal stents (BMSs).