929
Views
9
CrossRef citations to date
0
Altmetric
Research Paper

RARα and RARγ reciprocally control K5+ progenitor cell expansion in developing salivary glands

, , , , & ORCID Icon
Pages 125-140 | Received 12 Apr 2017, Accepted 15 Jul 2017, Published online: 13 Oct 2017

Figures & data

FIGURE 1. RARα negatively regulates K5+ salivary epithelial cells. (A) Whole explants cultured ex vivo for 72 hours with RARα (α ago) agonist show decreased expansion of K5+ cells in the main duct, while K5 extends beyond the primary duct relative to vehicle control (Veh) with RARα inhibition (α inhib) by ICC in single confocal sections. Ducts are outlined with red dotted line. Scale bar, 100 μm. (B) Quantification of K5+ area in the main duct normalized to the total main duct area indicates significantly increased K5+ with RARα inhibition. Veh n = 19, α ago n = 6, α inhib n = 15 explants. Statistical analysis completed using Student's two-tailed t-test. **p = 0.003, α ago p = 0.056. (C, D) E12.5 explants were cultured for 48 hours. Western blot and quantification of Western blot indicates significantly decreased levels of K5 with RARα agonism and significantly increased K5 levels with RARα inhibition as normalized to GAPDH levels. Mean represents three or more experiments with n ≥ 5 glands per condition. Statistical analysis completed using Student's two-tailed t-test. *p = 0.04, ***p<0.0001. (E, F) E12.5 epithelial rudiments were cultured for 48 hours. Quantification of the K5+ ductal area relative to total ductal area with RARα inhibition shows significantly increased K5+ area. Scale bar 100 μm. Veh n = 12, α inhib n = 11 explants. Statistical analysis completed using Student's two-tailed t-test. *p = 0.045.
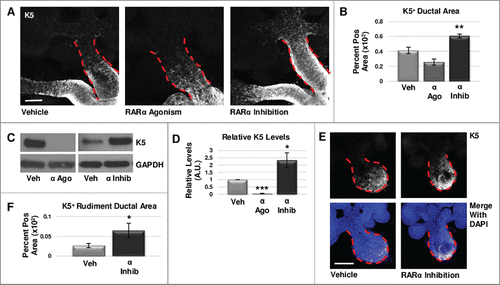
FIGURE 1. RARα negatively regulates K5+ salivary epithelial cells. (A) Whole explants cultured ex vivo for 72 hours with RARα (α ago) agonist show decreased expansion of K5+ cells in the main duct, while K5 extends beyond the primary duct relative to vehicle control (Veh) with RARα inhibition (α inhib) by ICC in single confocal sections. Ducts are outlined with red dotted line. Scale bar, 100 μm. (B) Quantification of K5+ area in the main duct normalized to the total main duct area indicates significantly increased K5+ with RARα inhibition. Veh n = 19, α ago n = 6, α inhib n = 15 explants. Statistical analysis completed using Student's two-tailed t-test. **p = 0.003, α ago p = 0.056. (C, D) E12.5 explants were cultured for 48 hours. Western blot and quantification of Western blot indicates significantly decreased levels of K5 with RARα agonism and significantly increased K5 levels with RARα inhibition as normalized to GAPDH levels. Mean represents three or more experiments with n ≥ 5 glands per condition. Statistical analysis completed using Student's two-tailed t-test. *p = 0.04, ***p<0.0001. (E, F) E12.5 epithelial rudiments were cultured for 48 hours. Quantification of the K5+ ductal area relative to total ductal area with RARα inhibition shows significantly increased K5+ area. Scale bar 100 μm. Veh n = 12, α inhib n = 11 explants. Statistical analysis completed using Student's two-tailed t-test. *p = 0.045.

FIGURE 2. RARγ positively regulates K5+ salivary epithelial cells. (A) ICC for K5 in whole glands cultured ex vivo for 72 hours shows slightly increased expansion of K5+ cells with RARγ agonist (γ ago) in the main duct, and decreased expansion of K5 in the main duct of RARγ-inhibited (γ inhib) glands. Ducts are outlined with red dotted line. Scale bar, 100 μm. (B) Quantification of K5+ area in the main duct of RARγ-inhibited whole glands shows significantly decreased K5+ area, indicating that signaling through RARγ may be necessary but not sufficient to maintain K5+ cells. Ago veh n = 12, γ ago n = 9, veh inhib n = 19, γ inhib n = 14 explants. Statistical analysis completed using Student's two-tailed t-test. ***p = 0.0006. (C, D) E12.5 glands were cultured ex vivo for 48 hours. Western blot and quantification indicates a slight increase in K5 levels with RARγ agonist while K5 levels are almost absent with RARγ inhibitor as normalized to GAPDH levels. n ≥ 3 experiments with n ≥ 5 glands per condition. Statistical analysis completed using Student's two-tailed t-test. ***p < 0.0001. (E) E12.5 epithelial rudiments were cultured for 48 hours. ICC for K5 shows decreased K5+ ductal area with RARγ inhibition as compared to vehicle control. (F) Quantification of ICC for K5 in the ductal area of isolated epithelial rudiments shows significantly decreased K5 with RARγ inhibition indicating RARγ actions are endogenous to the epithelium. K5+ area normalized to total main duct area. Scale bar 100 μm. Veh n = 12 γ inhib n = 11 explants. Statistical analysis completed using Student's two-tailed t-test. *** p = 0.0004.
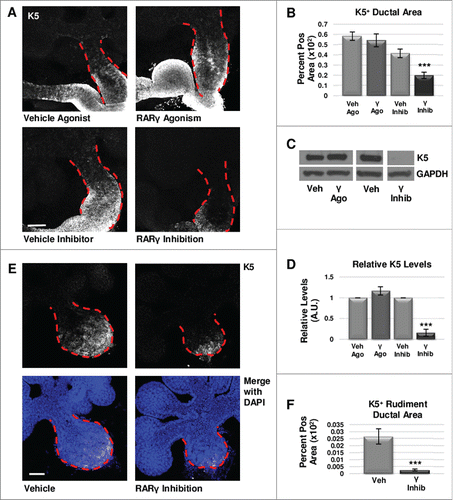
FIGURE 2. RARγ positively regulates K5+ salivary epithelial cells. (A) ICC for K5 in whole glands cultured ex vivo for 72 hours shows slightly increased expansion of K5+ cells with RARγ agonist (γ ago) in the main duct, and decreased expansion of K5 in the main duct of RARγ-inhibited (γ inhib) glands. Ducts are outlined with red dotted line. Scale bar, 100 μm. (B) Quantification of K5+ area in the main duct of RARγ-inhibited whole glands shows significantly decreased K5+ area, indicating that signaling through RARγ may be necessary but not sufficient to maintain K5+ cells. Ago veh n = 12, γ ago n = 9, veh inhib n = 19, γ inhib n = 14 explants. Statistical analysis completed using Student's two-tailed t-test. ***p = 0.0006. (C, D) E12.5 glands were cultured ex vivo for 48 hours. Western blot and quantification indicates a slight increase in K5 levels with RARγ agonist while K5 levels are almost absent with RARγ inhibitor as normalized to GAPDH levels. n ≥ 3 experiments with n ≥ 5 glands per condition. Statistical analysis completed using Student's two-tailed t-test. ***p < 0.0001. (E) E12.5 epithelial rudiments were cultured for 48 hours. ICC for K5 shows decreased K5+ ductal area with RARγ inhibition as compared to vehicle control. (F) Quantification of ICC for K5 in the ductal area of isolated epithelial rudiments shows significantly decreased K5 with RARγ inhibition indicating RARγ actions are endogenous to the epithelium. K5+ area normalized to total main duct area. Scale bar 100 μm. Veh n = 12 γ inhib n = 11 explants. Statistical analysis completed using Student's two-tailed t-test. *** p = 0.0004.

FIGURE 3. RARα maintains K5+ cells through negative cell cycle regulation. (A) E12.5 glands were cultured for 24 hours with or without RARα inhibitor. Analysis of non-phase specific cell cycle marker Ki67 using qPCR indicates RARα inhibition increases Ki67 expression, suggesting an overall increase in cells traversing the cell cycle. Mean represents two experiments run in triplicate with n ≥ 5 glands per condition. Statistical analysis performed using Student's two-tailed t-test. p = 0.03. (B) E12.5 explants were cultured for 48 hours with or without RARα inhibitor. EdU was incorporated into the media during the last two hours of culture to mark cells in S-phase showing increased staining in the main duct (outlined in red) with RARα inhibition. Scale bar,100 μm. (C) Quantification of ICC indicates significantly increased EdU staining in the main duct of RARα-inhibited glands as compared to vehicle control, indicating increased numbers of cells in S-phase. EdU+ area normalized to total main duct area. Veh n = 23, α ago n = 13, α inhib n = 9 explants. Statistical analysis completed using Student's two-tailed t-test. **p = 0.005. (D) ICC for M-phase marker, phospho-histone H3 (pHH3), shows an increase in staining in the main duct (outlined in white) of RARα-inhibited glands as compared to control. Scale bar, 100 μm. (E) Quantitative ICC for pHH3 shows an increasing trend in the main duct of RARα-inhibited glands as compared to control. pHH3+ area normalized to total main duct area. Veh n = 22, α ago n = 13, α inhib n = 9 explants. Statistical analysis completed using Student's two-tailed t-test. *p = 0.02.
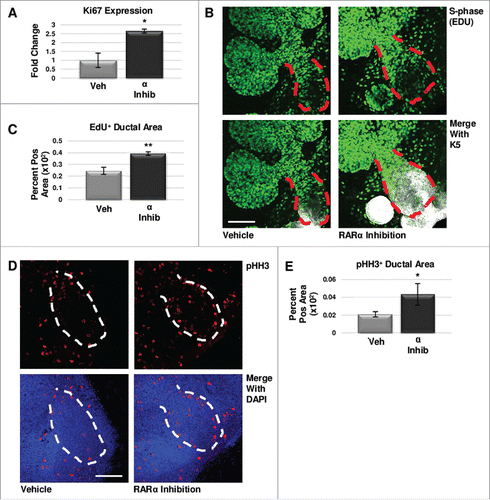
FIGURE 3. RARα maintains K5+ cells through negative cell cycle regulation. (A) E12.5 glands were cultured for 24 hours with or without RARα inhibitor. Analysis of non-phase specific cell cycle marker Ki67 using qPCR indicates RARα inhibition increases Ki67 expression, suggesting an overall increase in cells traversing the cell cycle. Mean represents two experiments run in triplicate with n ≥ 5 glands per condition. Statistical analysis performed using Student's two-tailed t-test. p = 0.03. (B) E12.5 explants were cultured for 48 hours with or without RARα inhibitor. EdU was incorporated into the media during the last two hours of culture to mark cells in S-phase showing increased staining in the main duct (outlined in red) with RARα inhibition. Scale bar,100 μm. (C) Quantification of ICC indicates significantly increased EdU staining in the main duct of RARα-inhibited glands as compared to vehicle control, indicating increased numbers of cells in S-phase. EdU+ area normalized to total main duct area. Veh n = 23, α ago n = 13, α inhib n = 9 explants. Statistical analysis completed using Student's two-tailed t-test. **p = 0.005. (D) ICC for M-phase marker, phospho-histone H3 (pHH3), shows an increase in staining in the main duct (outlined in white) of RARα-inhibited glands as compared to control. Scale bar, 100 μm. (E) Quantitative ICC for pHH3 shows an increasing trend in the main duct of RARα-inhibited glands as compared to control. pHH3+ area normalized to total main duct area. Veh n = 22, α ago n = 13, α inhib n = 9 explants. Statistical analysis completed using Student's two-tailed t-test. *p = 0.02.

FIGURE 4. RARγ Maintains K5+ Cells Through Cell Cycle Regulation. (A) E12.5 explants were cultured for 48 hours with or without RARγ inhibitor with the incorporation of EdU for the last two hours. Scale bar, 100 μm. (B) ICC for M-phase marker pHH3 shows a decrease in positive staining in the main duct of RARγ-inhibited glands as compared to control. Scale bar, 100 μm. (C) Quantitative immunocytochemistry indicates significantly decreased EdU staining in the main duct of RARγ-inhibited glands as compared to vehicle control, indicating decreased numbers of cells in S-phase. EdU+ area normalized to total main duct area. Veh inhib n = 23, γ inhib n = 9 explants. Statistical analysis completed using Student's two-tailed t-test. ***p ≤ 0.001. (D) Quantitative immunocytochemistry for pHH3 shows a significant decrease in pHH3 positively stained area in the main duct of RARγ-inhibited glands as compared to control, indicating significantly fewer cells in M-phase. pHH3+ area normalized to total main duct area. Veh inhib n = 22, γ inhib n = 15 explants. Statistical analysis completed using Student's two-tailed t-test. *p = 0.04. Taken together, these results suggest G1 mediated cell cycle arrest.
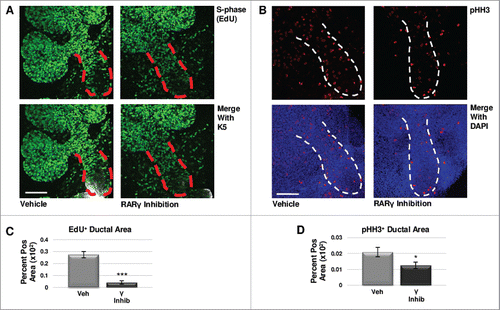
FIGURE 4. RARγ Maintains K5+ Cells Through Cell Cycle Regulation. (A) E12.5 explants were cultured for 48 hours with or without RARγ inhibitor with the incorporation of EdU for the last two hours. Scale bar, 100 μm. (B) ICC for M-phase marker pHH3 shows a decrease in positive staining in the main duct of RARγ-inhibited glands as compared to control. Scale bar, 100 μm. (C) Quantitative immunocytochemistry indicates significantly decreased EdU staining in the main duct of RARγ-inhibited glands as compared to vehicle control, indicating decreased numbers of cells in S-phase. EdU+ area normalized to total main duct area. Veh inhib n = 23, γ inhib n = 9 explants. Statistical analysis completed using Student's two-tailed t-test. ***p ≤ 0.001. (D) Quantitative immunocytochemistry for pHH3 shows a significant decrease in pHH3 positively stained area in the main duct of RARγ-inhibited glands as compared to control, indicating significantly fewer cells in M-phase. pHH3+ area normalized to total main duct area. Veh inhib n = 22, γ inhib n = 15 explants. Statistical analysis completed using Student's two-tailed t-test. *p = 0.04. Taken together, these results suggest G1 mediated cell cycle arrest.

FIGURE 5. Retinoid Signaling Promotes Lumenizing Cell Differentiation. (A) E12.5 explants were cultured for 72 hours and immunostained for basal marker K5 and ductal marker K19. Scale bar, 100 μm. (B) Quantification of K19-positive area in the main duct with RARα agonist shows significantly decreased K19, correlating with decreased K5, while no significant change in K19 is observed with RARα inhibition. Veh n = 11, α ago n = 6, α inhib n = 5 explants. Statistical analysis completed using Student's two-tailed t-test. *p = 0.02. (C) Quantification of K19-positive area in the main duct with RARγ agonist treatment indicates no significant change in K19, similar to RARα inhibition. With RARγ inhibition, K19 levels are significantly decreased corresponding to decreased K5. Ago veh n = 12, γ ago n = 9, veh inhib n = 11, γ inhib n = 5 explants. Statistical analysis completed using Student's two-tailed t-test. **p = 0.005. This data indicates that loss of K5 does not correspond with a gain of K19. (D) E12.5 explants cultured for 72 hours show increased expression of PROM-1 with RARα agonism and RARγ inhibition under conditions that show significantly decreased K5. Increased PROM-1 is not observed with RARα inhibition or RARγ agonism where K5 was increased. Scale bar, 100 μm. (E) Quantification of PROM-1 positive area in the main duct of the gland in cultures at both 72 hours and 96 hours (data not shown) indicates a significant increase in PROM-1 positive area with RARα agonist or RARγ inhibitor as compared to control. Veh n = 11, α ago n = 17, α inhib n = 10, ago veh n = 10, γ ago n = 10, veh inhib n = 15, γ inhib n = 15 explants. Statistical analysis completed using Student's two-tailed t-test. ***p < 0.0001. This data indicates RAR isoform-mediated decreases in K5 result in increased PROM-1 expression. (F) Lineage tracking using E12.5 K5- CreERT2;ROSA26-TdTomato mice cultured ex vivo for 68 hours following a four hour tamoxifen induction (1 μM) shows TdTomato reporter expression (white) in a handful of PROM-1 (red) positive cells in the main duct (yellow arrows), with ECAD (green) and DAPI (blue), indicating that these cells were derived from the K5 lineage. Scale bar, 50 μm.
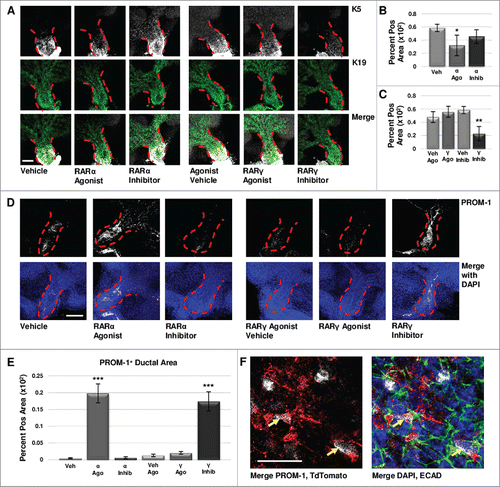
FIGURE 5. Retinoid Signaling Promotes Lumenizing Cell Differentiation. (A) E12.5 explants were cultured for 72 hours and immunostained for basal marker K5 and ductal marker K19. Scale bar, 100 μm. (B) Quantification of K19-positive area in the main duct with RARα agonist shows significantly decreased K19, correlating with decreased K5, while no significant change in K19 is observed with RARα inhibition. Veh n = 11, α ago n = 6, α inhib n = 5 explants. Statistical analysis completed using Student's two-tailed t-test. *p = 0.02. (C) Quantification of K19-positive area in the main duct with RARγ agonist treatment indicates no significant change in K19, similar to RARα inhibition. With RARγ inhibition, K19 levels are significantly decreased corresponding to decreased K5. Ago veh n = 12, γ ago n = 9, veh inhib n = 11, γ inhib n = 5 explants. Statistical analysis completed using Student's two-tailed t-test. **p = 0.005. This data indicates that loss of K5 does not correspond with a gain of K19. (D) E12.5 explants cultured for 72 hours show increased expression of PROM-1 with RARα agonism and RARγ inhibition under conditions that show significantly decreased K5. Increased PROM-1 is not observed with RARα inhibition or RARγ agonism where K5 was increased. Scale bar, 100 μm. (E) Quantification of PROM-1 positive area in the main duct of the gland in cultures at both 72 hours and 96 hours (data not shown) indicates a significant increase in PROM-1 positive area with RARα agonist or RARγ inhibitor as compared to control. Veh n = 11, α ago n = 17, α inhib n = 10, ago veh n = 10, γ ago n = 10, veh inhib n = 15, γ inhib n = 15 explants. Statistical analysis completed using Student's two-tailed t-test. ***p < 0.0001. This data indicates RAR isoform-mediated decreases in K5 result in increased PROM-1 expression. (F) Lineage tracking using E12.5 K5- CreERT2;ROSA26-TdTomato mice cultured ex vivo for 68 hours following a four hour tamoxifen induction (1 μM) shows TdTomato reporter expression (white) in a handful of PROM-1 (red) positive cells in the main duct (yellow arrows), with ECAD (green) and DAPI (blue), indicating that these cells were derived from the K5 lineage. Scale bar, 50 μm.
Supplemental material

1358336_Supplemental_Material.pptx

Download MS Power Point (61.1 MB)

Reprints and Corporate Permissions

Please note: Selecting permissions does not provide access to the full text of the article, please see our help page How do I view content?

To request a reprint or corporate permissions for this article, please click on the relevant link below:

Academic Permissions

Please note: Selecting permissions does not provide access to the full text of the article, please see our help page How do I view content?

Obtain permissions instantly via Rightslink by clicking on the button below:

If you are unable to obtain permissions via Rightslink, please complete and submit this Permissions form. For more information, please visit our Permissions help page.