Figures & data
FIGURE 1. Percentages and numbers of total TECs (EpCAM+CD45− cells) in WT and EphB-deficient thymuses throughout fetal development. (A) Comparative analysis of the proportions of EpCAM+CD45− cells between WT and mutant fetal thymuses. (B) Comparative analysis of the numbers of total TECs between WT and mutant thymuses. The significance of the Student's t-test probability is indicated as *p ≤ 0.05; **p ≤ 0.01; ***p ≤ 0.005; or #p ≤ 0.05; ##p ≤ 0.01; ###p ≤ 0.005. ns: non-significant.
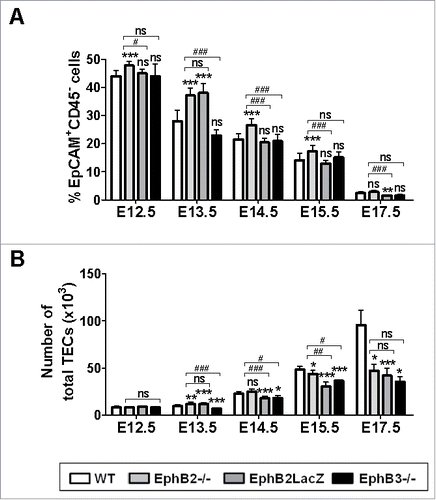
FIGURE 2. Maturation of the TEC subsets defined by Ly51/UEA1 expression during fetal development (E12.5-E17.5) in both WT and EphB-deficient mice. (A) Dot plots, representative of the performed analyses gating in total WT and mutant EpCAM+CD45− epithelial cells, show the maturation of distinct cell subsets defined by Ly51 and/or UEA1 expression. (B) Proportions of both WT and mutant thymic Ly51−UEA1− cells throughout embryonic development. (C) Proportions of both WT and mutant thymic Ly51loUEA1− cells during development. (D) Changes in the proportions of thymic Ly51medUEA1− cells in WT and mutant embryonic thymuses. Proportions of both Ly51medUEA1lo/med (E) and Ly51hiUEA1lo/med (F) cell subsets during embryonic development of WT and mutant thymuses. The significance of the Student's t-test probability is indicated as *p ≤ 0.05; **p ≤ 0.01; ***p ≤ 0.005; or #p ≤ 0.05; ###p ≤ 0.005. ns: non-significant.
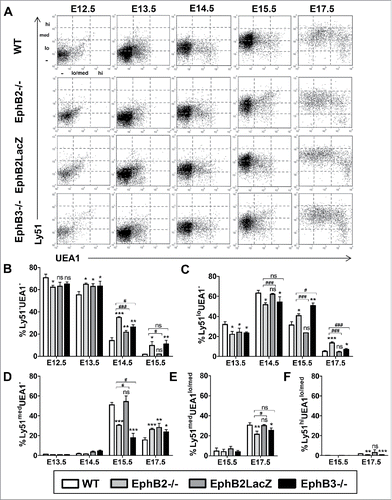
FIGURE 3. Maturation of cTEC subsets based on Ly51/CD205 expression in both WT and EphB-deficient thymuses. (A) Dot plots show the evolution of Ly51+CD205− and Ly51+CD205+ cTEC subpopulations at E14.5 and E15.5 in both WT and mutant thymuses. (B) Proportions of both Ly51+CD205− and Ly51+CD205+ cTECs in WT and mutant thymuses. The significance of the Student's t-test probability is indicated as *p ≤ 0.05; **p ≤ 0.01; ***p ≤ 0.005; or #p ≤ 0.05; ##p ≤ 0.01; ###p ≤ 0.005. ns: non-significant.
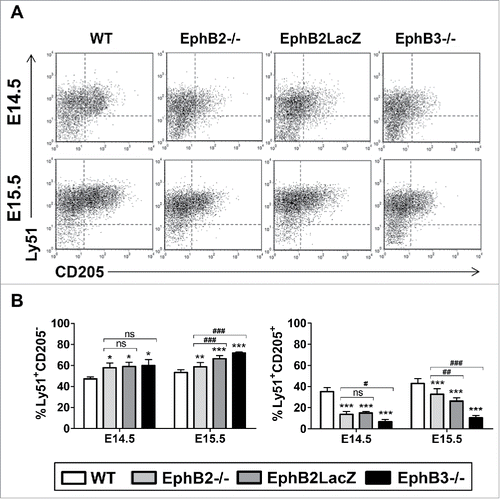
FIGURE 4. cTEC subsets defined by the expression of Ly51 and MHCII cell markers during fetal development (E12.5-E17.5) of both WT and EphB-deficient thymuses. (A) Dot plots show different TEC subsets defined by Ly51/MHCII expression throughout thymus development. They are representative of different analyses of TEC subsets gated in the total EpCAM+CD45− epithelial cell population. (B) Proportions of MHCII−Ly51− cells in WT and EphB-deficient embryonic thymuses. Proportions of both MHCIIloLy51lo (C) and MHCIImedLy51lo (D) cells in WT and mutant thymuses. (E) Proportions of MHCIImedLy51med cells in WT and mutant embryonic thymuses. (F, G) Percentage of mature MHCIIhiLy51med (F) and MHCIIhiLy51hi (G) cTECs in WT and mutant embryonic thymuses. The significance of the Student's t-test probability is indicated as *p ≤ 0.05; **p ≤ 0.01; ***p ≤ 0.005 or #p ≤ 0.05; ##p ≤ 0.01; ###p ≤ 0.005. ns: non-significant.
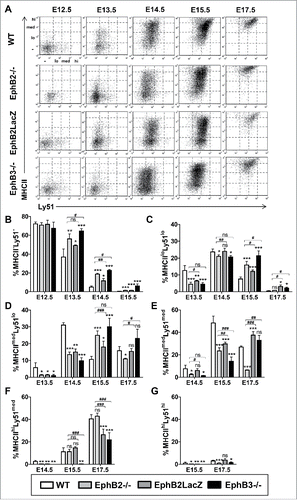
FIGURE 5. cTEC subsets defined by the expression of Ly51 and CD40 or β5t cell markers and epithelial cell apoptosis during fetal development in both WT and EphB-deficient mice. (A) Dot plots show different TEC subsets defined by CD40/Ly51 expression throughout thymus development. CD40 expression in thymic cortex defines three cell subsets: negative (−), low (lo) (B, C) and medium/high (med/hi) (D, E) whose maturation in WT and mutant thymuses is represented in figures A to E. (F) The histogram shows a representative example of β5t expression (black line) in cortical EpCAM+CD45−Ly51+ cells (R1) at E15.5 respect to the negative expression in thymocytes (grey line). (G) Proportions of β5t+ cells in the cTEC subset, at E13.5, E15.5 and E17.5, determined by flow cytometry. (H) Significantly lower proportions of apoptotic EpCAM+CD45− epithelial cells at E12.5 and higher at E13.5 in mutant thymuses. The significance of the Student's t-test probability is indicated as *p ≤ 0.05; **p ≤ 0.01; ***p ≤ 0.005 or #p ≤ 0.05; ##p ≤ 0.01; ###p ≤ 0.005. ns: non-significant.
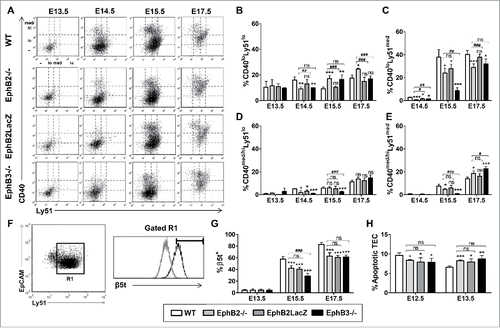
FIGURE 6. Proportions of cycling cells in different epithelial cell subsets of both WT and EphB-mutant thymuses during fetal development (E12.5-E17.5). Figure represents the proportions of cycling cells defined as cells in S+G2/M phases. (A) Proportions of cycling total EpCAM+CD45− cells in both WT and mutant. (B) Changes in the proportions of cycling MTS20+ cells during thymus development are similar to those observed for the total EpCAM+CD45− TECs in both WT and mutant thymuses. (C) Proportions of both WT and mutant cycling MTS20− cells during thymus maturation. (D) Proportions of cycling Ly51−UEA1− cells in WT and mutant developing thymuses. (E) Percentage of cycling Ly51+UEA1− cTECs in mutant and WT thymuses. The significance of the Student's t-test probability is indicated as *p ≤ 0.05; **p ≤ 0.01; ***p ≤ 0.005 or #p ≤ 0.05; ##p ≤ 0.01; ###p ≤ 0.005. ns: non-significant.
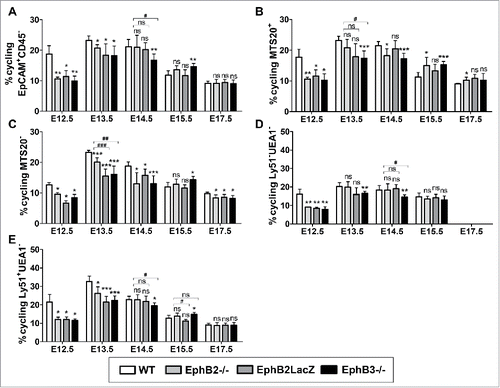
FIGURE 7. Expression of EphB and ephrin-B in WT thymic cells during early development (E12.5-E15.5). The figure shows the proportions of either TECs (A) or thymocytes (B) expressing EphB2, EphB3, ephrin-B1 and ephrin-B2 evaluated by flow cytometry. (C) Pattern of expression of EphB and ephrin-B in the WT and mutant Ly51−UEA1− cell population (D) Variations in the proportions of Eph/ephrin-B-expressing Ly51+UEA1− cTECs in WT and mutant embryonic thymuses. The significance of the Student's t-test probability is indicated between stages as *p ≤ 0.05; **p ≤ 0.01; ***p ≤ 0.005.
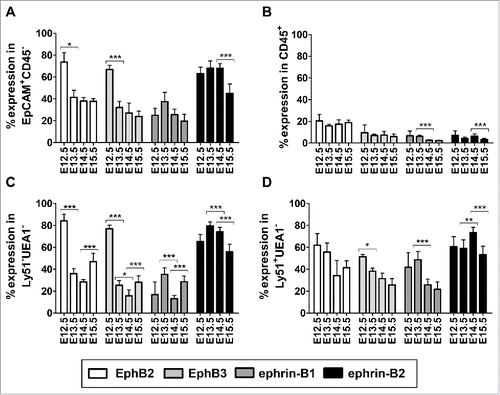
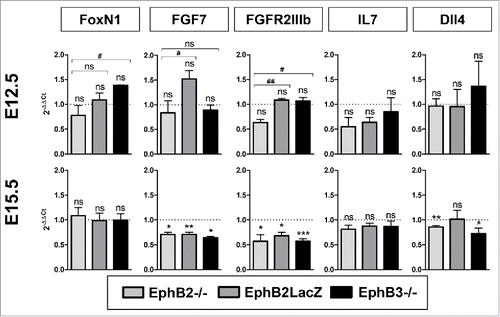
FIGURE 8. Expression of genes involved in thymic cell maturation in EphB-deficient thymuses. Figure shows the relative expression, RQ (2−ΔΔCt), of FoxN1, FGF7, FGFR2IIIb, IL7 and Dll4 transcripts in mutant cells relative to WT values (value 1, dotted line). At E12.5, the expression was determined on total thymic lobes whereas at E15.5 sorted EpCAM+CD45− TECs or, for FGF7 expression, EpCAM−CD45− mesenchymal cells were studied. The relative expression of mutant values was compared to the WT using the one-t test and between mutants according to Student's t-test. The significance is indicated as: *p ≤ 0.05; **p ≤ 0.01; ***p ≤ 0.005 or #p ≤ 0.05; ##p ≤ 0.01. ns: non-significant.