Figures & data
FIGURE 1. Schematic of the sensing principle of the competitive immuno-aggregation assay. A) In the absence of VEGF, microparticles (MPs) functionalized with biotinylated VEGF antibody (Ab) form aggregates via biotin-streptavidin (SA) specific binding. Hence, the average volume of all particles/aggregates within the solution increases once SA is added. B) When VEGF is added, the VEGF protein competes with the anti-biotin MPs to bind biotinylated VEGF Ab during the conjugation process, leading to decreased aggregation of the MPs. C) The average particle/aggregate volume can be accurately detected by the micro-Coulter counter. The average volume of all particles/aggregates from each sample can be used to estimate the VEGF concentration.
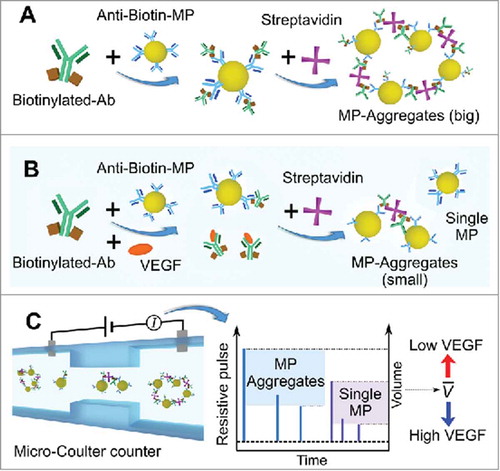
FIGURE 2. A) Picture of the micro-Coulter counter. B) Microscopic image of sensing channel.
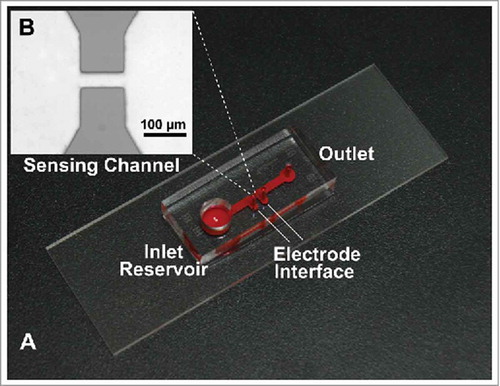
FIGURE 3. Microscopy images of microparticles (MPs)/aggregates from the A) negative control group, B) positive control group and C) competitive aggregation group with VEGF at 12.00 ng/mL. D) Average volume of MPs/aggregates measured from the corresponding groups.
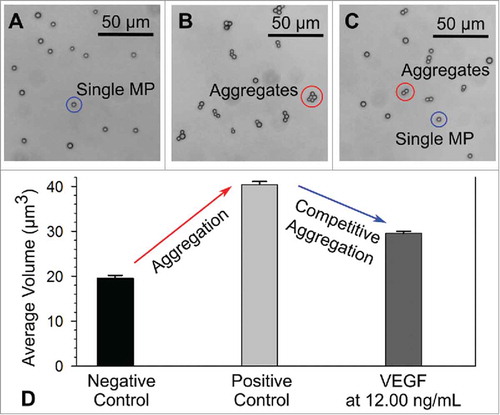
FIGURE 4. Standard VEGF sample testing results where the normalized volume change varied as a function of the VEGF concentration, which ranged from 0.01 to 100.00 ng/mL.
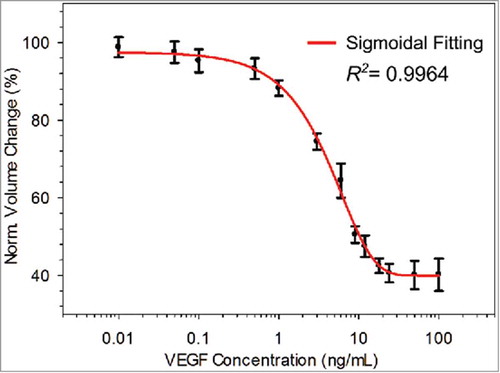
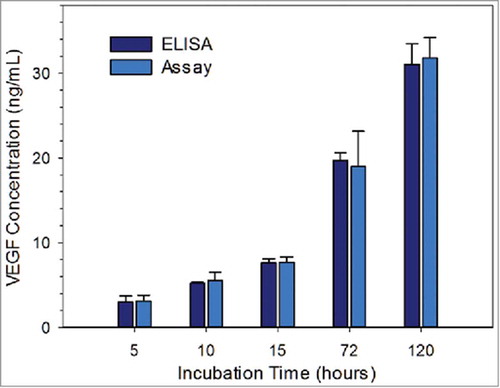
FIGURE 5. Measured VEGF concentration of cell secretome samples via ELISA and the competitive immuno-aggregation assay; the samples were collected at 5, 10, 15, 72, 120 hours. Student's t-test result (provided in the Supporting Information) showed no statistically significant difference between the corresponding VEGF protein concentrations.