Figures & data
FIGURE 1. (A) Decellularization system of the lung. (B) Gross findings of decellularization of the lungs.
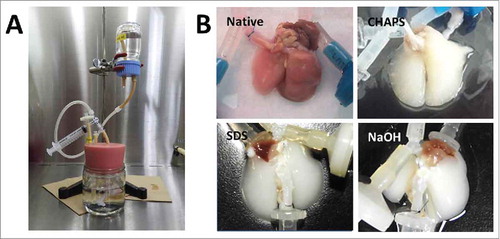
FIGURE 2. Histopathological examination and Scanning electron microscopy of native, CHAPS-treated, SDS-treated and NaOH-treated decellularized lungs. Scale bar = 200 μm.
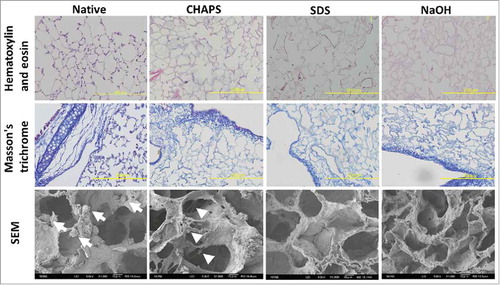
FIGURE 3. (A) Immunohistochemical staining of native, CHAPS-treated, SDS-treated and NaOH-treated decellularized lungs for fibronectin, laminin and β-actin. Scale bar = 10 μm. (B) Bar graph showing immune-positive area per alveolus of fibronectin, laminin and β-actin, which was calculated in image J software. Asterisk indicates significance of difference between the groups (*P < 0.005, **P < 0.05).
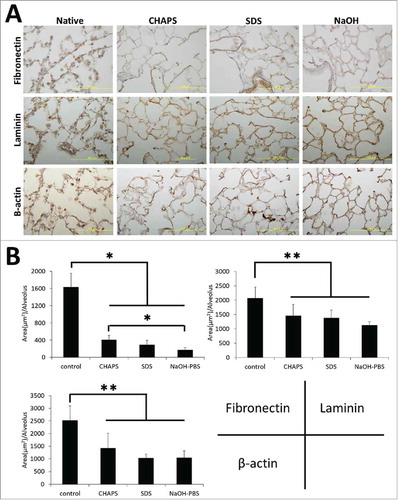
FIGURE 4. Graphs of matrix protein and DNA quantifications of native, CHAPS-treated, SDS-treated and NaOH-treated decellularized lungs. (A) Collagen assay. (B) GAG assay. (C) DNA assay.
FIGURE 5. (A) Histopathological findings of SDS-treated and NaOH-treated recellularized lung. Scale bar = 200 μm. Bar graph showing the average number of reseeded HUVECs within a high power view (HPV) area (P = 0.310). (B) Findings of gas exchange functional analysis. Note hemoglobin vesicles-PBS solution was harvested from the cannulated pulmonary vein (white arrow).
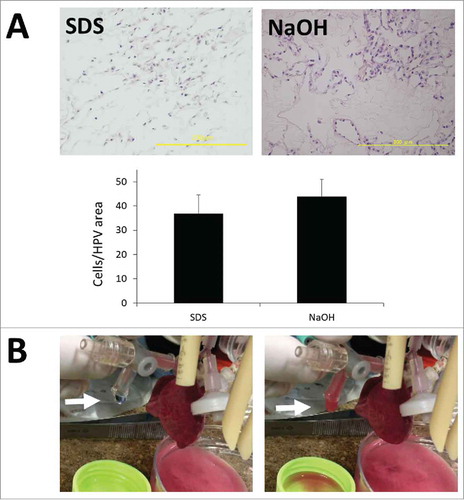
TABLE 1. Gas exchange function of regenerated lung with or without ventilation evaluated by HbVs-PBS solution
FIGURE 6. Total costs ($) for the CHAPS-treated, SDS-treated and NaOH-treated decellularization for rat lungs.