Figures & data
FIGURE 1. Celastrol improves viability and proliferation of mouse inner ear stem cells in a dose-dependent manner. Cell viability (A) and proliferation (B) of the mouse inner ear stem cells were measured by MTT and BrdU incorporation assay, respectively, after 48 hr treatments of increasing Celastrol doses (0, 1, 2, 5 and 10 μM). Values were shown as mean + SD. *p < 0.05, **p < 0.01, n not significant, compared to 0 μM Celastrol.
FIGURE 2. Celastrol improves the capability of sphere formation. Isolated inner ear stem cells were incubated in the presence or absence of 2 μM Celastrol, and sphere diameter (A) and number of spheres/104 cells (B) were measured at indicated time points. Values were shown as mean + SD. *p < 0.05, **p < 0.01, compared to 0 μM Celastrol control.
FIGURE 3. Celastrol upregulates Atoh1 expressions in inner ear stem cells and formed spheres. (A) Atoh1 mRNA and protein expressions in the mouse inner ear stem cells were measured by RT-PCR and Western blot analyses, respectively, in the presence or absence of 2 μM Celastrol. (B) Atoh1 mRNA and protein expressions in the spheres, formed by the inner stem cell culture after 7 days, were measured by RT-PCR and Western blot analyses, respectively, in the presence or absence of 2 μM Celastrol. Values were shown as mean + SD. *p < 0.05, **p < 0.01, compared to 0 μM Celastrol control.
FIGURE 4. Celastrol improves differentiation of mouse inner ear stem cells to neurons. Inner ear stem cells were subjected to neuronal differentiation for 2 weeks, in the presence (Celastrol) or absence (No Celastrol) of 2 μM Celastrol, using undifferentiated inner ear stem cells (SCs) as negative control, and hippocampal neurons as positive control (HNs). (A) Density of neurons in culture. (B) MAP-2 mRNA and protein expressions in the culture were measured by RT-PCR and Western blot analyses, respectively. Values were shown as mean + SD. *p < 0.05, **p < 0.01, compared to no Celastrol control. # p < 0.05, compared to SCs. (C) Representative fluorescence images of the differentiated neuronal culture, stained for MAP-2 in green and DAPI in blue. Scale bar 200 µm.
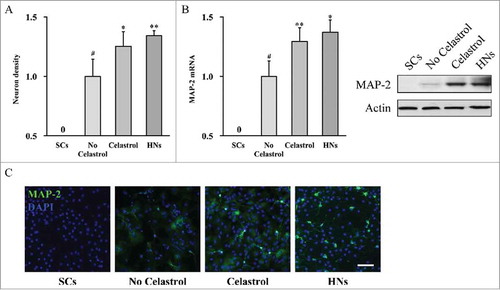
FIGURE 5. Celastrol enhances calcium fluctuation. Following 2 weeks of neuronal differentiation of mouse inner ear stem cells in the presence or absence of 2 μM Celastrol, changes in Ca2+ concentration (A), % cells with Ca2+ oscillations (B) and spike frequency (C) were measured. Values were shown as mean + SD. **p < 0.01, compared to 0 μM Celastrol control.
FIGURE 6. Celastrol enhances neuronal-like cell identity in the inner ear stem cell derived neurons, as well as their electrophysiological function. (A) Myosin VI mRNA and protein expressions in the culture were measured by RT-PCR and Western blot analyses, respectively. Values were shown as mean + SD. *p < 0.05, **p < 0.01, compared to 0 μM Celastrol control. (B) Voltage-dependent currents were recorded from the derived neuronal-like cells bathed in 1.3 mM Ca2+, in the presence or absence of 2 μM Celastrol.