Figures & data
Table 1. List of primers.
Figure 1. Decellularized whole rat liver. (a) Schematic representation of the decellularization process the native rat liver turns light brown after 1X PBS perfusion and gradually turns white and then translucent with 0.1% SDS after 4 h. The complete decellularization was evident from the appearance of visible vascular networks and clear veins. (b) Hematoxylin and Eosin staining of native rat liver and decellularized rat liver showing presence and absence of nucleic material (blue), respectively. Masson’s trichrome staining of native rat liver showing the presence of collagen (blue), pink cytoplasm while the decellularized rat liver shows the presence of abundant collagen but absence of cytoplasm and nuclei, respectively. The arrows indicating the presence of blood vessels. SEM images of native rat liver tissue show the presence of populated hepatocytes throughout the liver matrix. Decellularized rat liver matrix without the cellular content along with networks of ECM fibers with lamellar structures was observed.
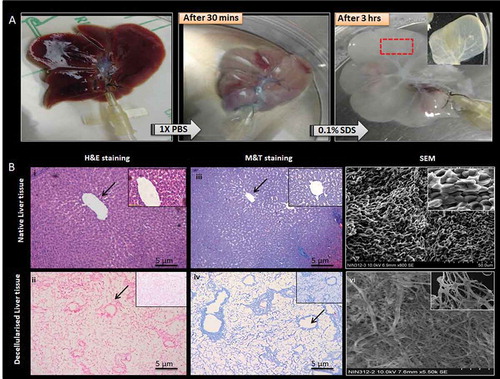
Figure 2. Determination of ECM and cellular components. Specific ECM proteins and the cellular components of the acellular liver bio-scaffold comparison with fresh rat liver tissue were studied. (a-d) Immunostaining results of the fresh liver showed collagen type I, laminins and reticulins mostly around larger vessels and also throughout the parenchymal spaces consistent with their localization of nuclear staining with DAPI. (e-h) similarly, the ECM proteins (Collagen type I and laminins) were observed around vascular basal membrane and parenchymal areas of the acellular liver bioscaffold. Reticulin staining demonstrated the presence of reticular fibers in the parenchymal matrix of the decellularized tissues. However, the nuclear component was not visible in the decellularized liver matrix upon staining with DAPI. (i) The residual DNA content decreased significantly in the decellularized rat livers (11 ± 4 µg/ml) as compared to normal rat livers (980 ± 18 µg/ml) measured per mg wet tissue weight (n = 5). (j) Collagen content in the native liver tissue was 53 ± 7 μg/mg wet tissue whereas, the collagen content of the decellularized matrix decreased to 49 ± 6 μg/mg wet tissue yet indicating that the fibrillary collagen of the native liver was retained after decellularization process (n = 5).
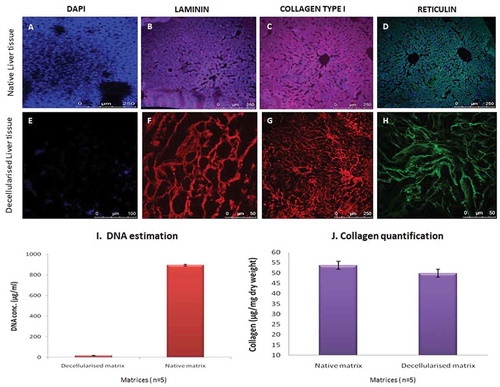
Figure 3. Re-population and characterization of rat liver scaffold. (a) The well-preserved liver scaffold was initially infused with the hepatocyte culture medium. Freshly isolated primary rat hepatocytes were infused into the scaffold through the PV of the decellularized liver. The decellularized liver was fully populated with hepatocytes and continuously perfused with the culture medium for the proliferation and functioning of the engrafted cells. (b) The H&E and MT staining of the reseeded liver graft showed uniform distribution of the hepatocytes throughout the liver section. The hepatocytes were repopulated around the vessels and the surrounding parenchymal spaces throughout ECM as evident from SEM analysis. The arrow indicating the group of hepatocytes in the scaffold. (c)The liver-specific proteins like albumin, CK 18, G6P, and AFP expression were observed (green fluorescence) on the cell surfaces and the nucleus was stained with DAPI (blue) of repopulated liver section. (d) Staining of the native rat liver as positive control and staining of the nucleus with DAPI as negative control without primary antibody.
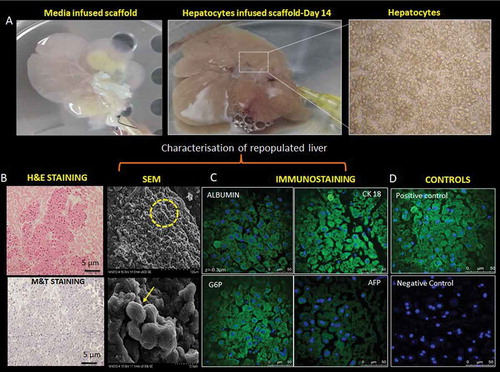
Figure 4. In vitro functional evaluation. (a) The urea synthesis by the recellularized liver graft increased continuously in the culture medium from day 3 to day 7 as compared to the 2D culture system. (b) The metabolism of the hepatocytes was well evident from the higher albumin production after 2 days (n = 5) in the 3D-engrafted culture system.
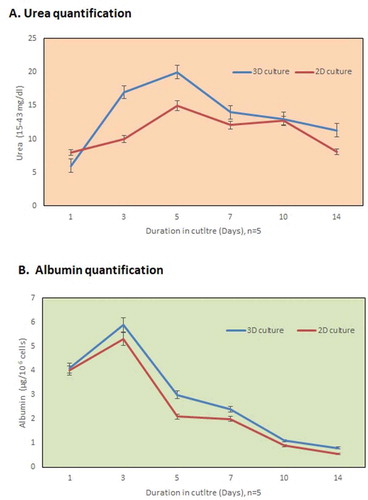
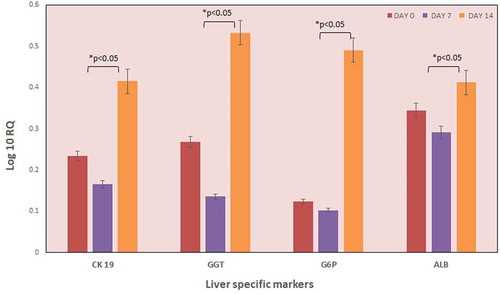
Figure 5. Expression of liver-specific genes. The expression of liver-specific genes of the recellularized liver graft was evaluated by qPCR analysis (n = 5). The graph indicates the expression levels of various liver-specific genes on different days. The data revealed increased levels of ALB, CK 19, GGT, and G6P genes by day 10. However, GGT and G6P gene expression were significantly higher after 10 days culture as compared to the preliminary expression levels. Data is expressed as mean ± SD with significance at p < .05.