Figures & data
Figure 1. Induced differentiation ability and characteristic surface markers of ADSC. (a) Differentiation abilities of cells were detected by cellular staining. The order from left to right and from top to bottom: uninduced ADSC, adipogenesis using Oil red O staining, osteogenesis using Alizarin red staining, and chondrogenesis using Alcian blue staining. (b) Specific surface markers of cells were examined by flow cytometry. The ADSC associated with markers were positive for CD73, CD105, and CD90 and were negative for CD11b, CD19, CD34, CD45, and HLA-DR.
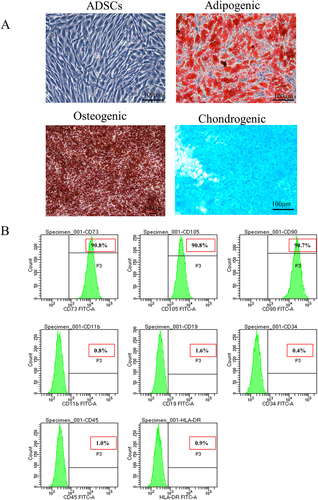
Figure 2. Dynamic ADSC distribution in vivo in an rats. (a) the timetable and flowchart of in vivo imaging (N = 3 for each time point). (b) Significantly elevated albuminuria in an model rats compared with normal rats after adriamycin challenge for 14 d (N = 6). (c) the growth curve of body weight. d) Fluorescence imaging of major organs from an model and normal rats after injection of DID-labeled ADSC through tail vein 7 and 14 d (N = 3 or 2). Data are presented as mean ± SEM.****p < 0.0001 vs normal control group.
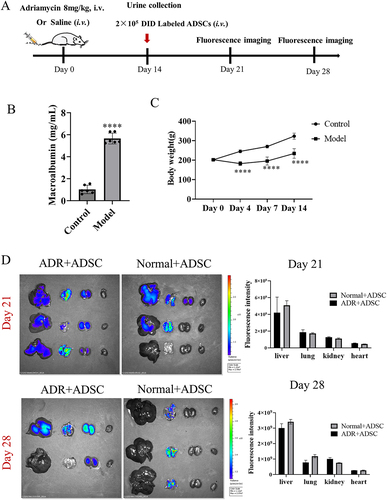
Table 1. The primer sequence.
Figure 3. Beneficial effects of ADSC treatment on biochemical indexes and histopathological injuries of an rats. (a) Timetable and flowchart of an establishment and ADSC therapy. (b) The growth curve of body weight in each group (N = 7). (c) kidney index (kidney weight/body weight) in each group (N = 7). (d) Spleen index (spleen weight/body weight) in each group (N = 7). (e-i): Biochemical indexes in each group (N = 7): (e) Serum low-density lipoprotein. (f) Serum triglycerides. (g) Serum urea nitrogen. h) Serum creatinine. (i) serum neutrophil gelatinase-associated lipocalin. (j) Urine neutrophil gelatinase-associated lipocalin/urine creatinine ratio. (k) Hematoxylin-eosin staining. (l) Statistical chart of glomerular diameter (N = 7). (m) Renal tubular injury score (N = 7). Data are presented as mean ± SEM. ****p < 0.05, *p < 0.01, **p < 0.001 vs Model group, ***p < 0.05 vs Control.
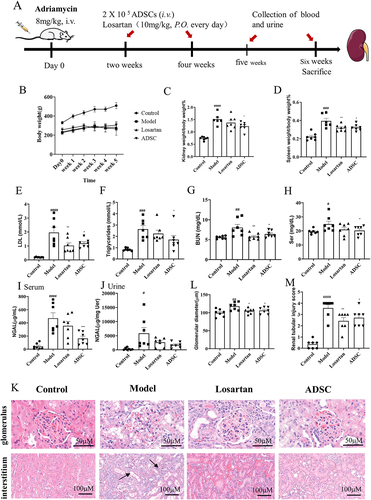
Figure 4. Effects of ADSC treatment on oxidative stress, inflammation of the kidney and nephrin expression. Determination of MDA (a) and GSH (b) in renal oxidative stress indexes. Relative mRNA expression of MCP-1(c), IL-1β(d), and IL-12(e) in kidney tissues (N = 7). (f) Representative images of nephrin expression in kidney site detected by immunofluorescence, and quantitative statistics of nephrin expression (N = 7). (g) Western blot analysis of nephrin in the kidney, and Bands were quantified and expressed in the graph. Data are presented as mean ± SEM. ****p < 0.05 vs Model group, *p < 0.05 vs Control, **p < 0.001 vs Control.
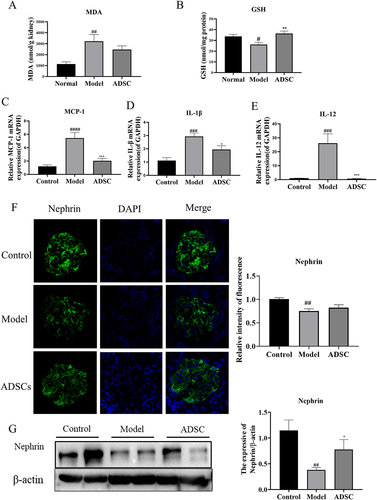
Figure 5. ADSC treatment alleviated glomerular and tubulointerstitial fibrosis in an model rats. a) Immunohistochemistry staining of Fibronectin and TGF-β1 in kidney tissues (N = 7). b) the Fibronectin positive area was quantitatively analyzed (N = 7). c) the TGF-β positive cells were quantitatively analyzed (N = 7). d) Western blot bands of Fibronectin and TGF-β1 in kidney tissues. e) Western blot analysis of fibronectin in kidney tissues. f) Western blot analysis of TGF-β1 in kidney tissues. g) the mRNA expression of fibronectin in kidney tissues (N = 7). h) the mRNA expression of TGF-β1 in kidney tissues (N = 7). Data are presented as mean ± SEM. ****p < 0.05, *p < 0.01, **p < 0.01 vs model. ***p < 0.05, #P < 0.001, *p < 0.001 vs control group.
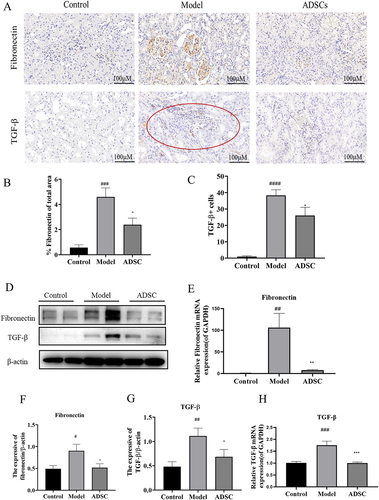
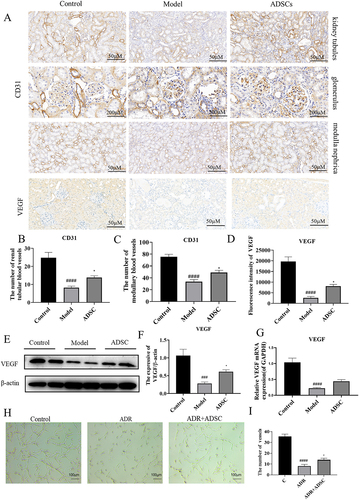
Figure 6. ADSC treatment promotes angiogenesis by increasing VEGF secretion in renal tissue. a) Immunohistochemistry staining of CD31 in kidney tissues, including kidney tubules, glomerulus, and medulla (N = 7). b–d) the number of vessels in renal tubule (b) and medulla (c) and the fluorescence intensity of VEGF expression (d) (N = 7). e) Western blot bands of VEGF in kidney tissues. f) Western blot analysis of TGF-β1 in kidney tissues. g) the mRNA expression of VEGF in kidney tissues (N = 7). h–i) ADSC treatment promotes rat vascular endothelial cell angiogenesis in vitro (N = 3). Data are presented as mean ± SEM. ****p < 0.05 vs. model. *p < 0.001, **p < 0.001, ***p < 0.0001 vs control group.