Figures & data
Figure 1 (See previous page). piRNA distribution across chromosomes and by copy number. (A) A frequency map of piRNA loci on chromosome 1. The frequency of the 667,944 piRNA loci in the human genome, along with loci for non-TE protein-coding genes, long interspersed nuclear elements (LINEs), and short interspersed nuclear elements (SINEs), was interrogated in 1 megabase blocks along the length of each chromosome. (B) Proximity between piRNA loci and protein-coding genes, LINEs, and SINEs was approximated by the degree of linear correlation between chromosomal frequency distributions. piRNA loci exhibited the highest degree of overlap with SINE loci (Pearson's r = 0.79, p < 0.0001), and moderate overlap with gene (Pearson's r = 0.59, p < 0.0001) and LINE (Pearson's r = 0.34, p < 0.0001) loci. (C) Genomic distribution of piRNA loci by piRNA copy number. The 23,439 unique piRNA sequences were divided into 19,124 single copy piRNA loci, 11,881 loci corresponding to 3,261 piRNAs with 2 to 10 copies, 67,079 loci corresponding to 806 piRNAs with 11 to 1000 copies, and 564,111 loci corresponding to 61 piRNAs with greater than 1000 copies, and subsequently matched to one of 3 genomic regions (exons, introns, or intergenic regions). Overall, there was a tendency for lower copy piRNA loci to overlap exons of protein-coding genes and higher copy loci to overlap introns, where repetitive transposable elements are frequently found.
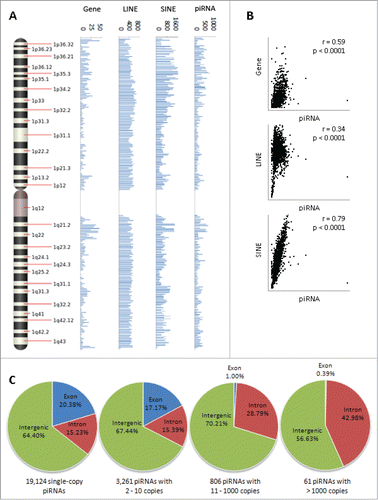
Figure 2. Genome-wide methylation changes following piRNA transfection. (A) CpG site methylation changes following individual transfection of 4 single-stranded piRNA mimics (hsa_piR_020409, hsa_piR_017183, hsa_piR_021285, and hsa_piR_023426) into Farage human lymphoma and MCF-7 human breast cancer cells. Of the 223 CpG sites that exhibited a unidirectional methylation change of 10% or greater in both Farage and MCF-7 cells, 212 (95.1%) displayed increased (+) methylation while only 11 (4.9%) displayed decreased (−) methylation. (B) Validation of methylation changes using EpiTYPER. In order to validate array measurements, methylation at 4 CpG sites (cg25798413, cg06011925, cg21939303, and cg12072178) and corresponding ~400–600 bp flanking regions was re-evaluated using Sequenom's EpiTYPER platform. Results of the EpiTYPER measurement were in directional agreement with those of the Infinium array. (C) Tissue-specific enrichment in expression of differentially methylated genes. Genes that exhibited a unidirectional change of 10% or greater and a nominal P-value < 0.05 in both cell lines were examined for tissue enrichment using the UniProt tissue expression function as implemented in the DAVID Bioinformatic Resource (v6.7). Statistically significant or borderline significant expression enrichment was found only for the brain in any of the 4 transfections (Fisher Exact α = 0.05).
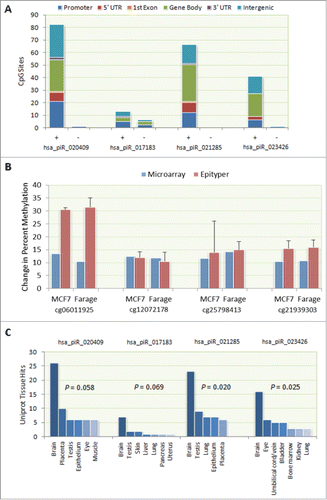
Figure 3. Correlation between piRNA mimic-associated gene methylation and mRNA expression. mRNA expression levels of 6 differentially methylated genes (CDK4, FAM150A, KDM3A, LHX5, SYCE1, and VAMP3) were measured by qPCR using RNA isolated from transfected Farage and MCF-7 cells. Consistent with expectation, higher LHX5 and SYCE1 promoter methylation was associated with lower mRNA expression in both transfected Farage (0.67-fold, NS and 0.53-fold, P = 0.008, respectively) and MCF-7 (0.47-fold; P < 0.001 and 0.35-fold; P < 0.001, respectively) cells. Similarly, higher KDM3A gene body methylation was associated with increased mRNA expression in both cell lines (Farage: 1.46-fold, P < 0.001; MCF-7: 2.54-fold, P = 0.057 (borderline significant)). Despite exhibiting higher 5′ UTR methylation, CDK4 exhibited higher expression in MCF-7 cells (1.69-fold; P = 0.004) and no expression difference in Farage cells. Expression differences were not observed for VAMP3 in either Farage or MCF-7 cells, despite higher promoter methylation. No FAM150A expression was detected in either cell line.
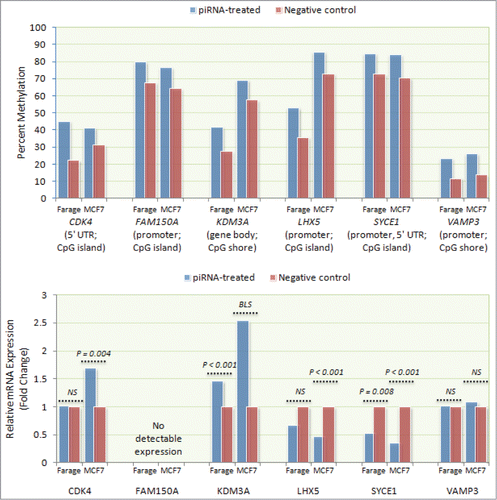
Figure 4. Bioinformatic identification of possible piRNA binding sites. (A) Schematic of the algorithmic logic used to screen CpG site flanking regions for potential piRNA binding sites. A computer algorithm was designed to screen for ≥ 8 bp continuous sequence matches between a flanking region 1,000 bp upstream and downstream of affected CpG sites and the original and the inverted complement of corresponding piRNA sequences. (B) The number of sequence matches between transfected piRNAs and the flanking regions of differentially methylated CpG sites was compared to the number of matches to the flanking regions of unaffected CpG sites. For each of the transfected piRNAs, we found a higher number of ≥ 8 bp matches to differentially methylated CpG sites compared to unaffected CpG sites.
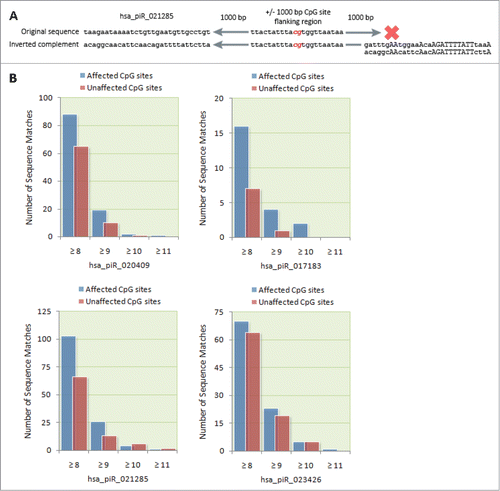
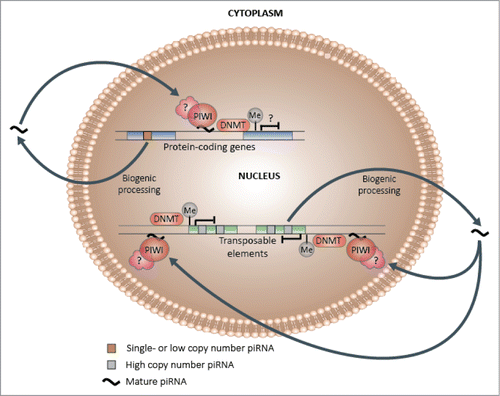
Figure 5. Hypothetical piRNA-dependent DNA methylation induction model. Following biogenic processing to their mature forms, a subset of single and low copy piRNAs may be capable of re-entering the nucleus and preferentially binding to complementary genic DNA or nascent mRNA, which may in turn lead to the induction of methylation at adjacent CpG sites and changes in transcriptional activity. In contrast, a higher proportion of high copy piRNAs, which are more likely to be derived from and share sequence similarity with transposable elements, may specialize in transposon regulation, which could encompass methylation-mediated transcriptional silencing.