3,890
Views
69
CrossRef citations to date
0
Altmetric
Research Paper

Pan-cancer transcriptome analysis reveals long noncoding RNAs with conserved function

, , , , , & show all
Pages 628-642 | Received 24 Oct 2014, Accepted 01 Apr 2015, Published online: 15 Jun 2015

Figures & data

Figure 1. LncRNA expression across 8 cancer types. (A) Schematic of pipeline used to create a comprehensive transcriptome annotation, filter lowly expressed transcripts, and identify altered lncRNAs. (B) Distribution of the number of cancer types that lncRNAs (blue) and protein coding genes (red) are enriched in. While coding genes generally have enriched expression across all cancers, lncRNAs tend to be less broadly enriched across multiple cancers. The inset pie chart shows the distribution of lncRNAs with enriched expression in only a single cancer: bladder urothelial carcinoma (BLCA), breast invasive carcinoma (BRCA), colorectal adenocarcinoma (CRC), head and neck squamous cell carcinoma (HNSC), kidney renal cell carcinoma (KIRC), lung adenocarcinoma (LUAD), lung squamous cell carcinoma (LUSC), and uterine corpus endometrial carcinoma (UCEC).
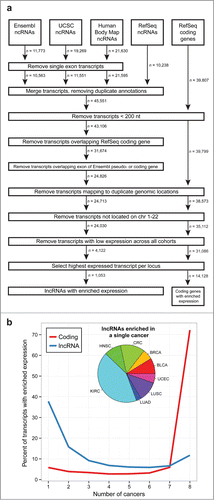
Figure 1. LncRNA expression across 8 cancer types. (A) Schematic of pipeline used to create a comprehensive transcriptome annotation, filter lowly expressed transcripts, and identify altered lncRNAs. (B) Distribution of the number of cancer types that lncRNAs (blue) and protein coding genes (red) are enriched in. While coding genes generally have enriched expression across all cancers, lncRNAs tend to be less broadly enriched across multiple cancers. The inset pie chart shows the distribution of lncRNAs with enriched expression in only a single cancer: bladder urothelial carcinoma (BLCA), breast invasive carcinoma (BRCA), colorectal adenocarcinoma (CRC), head and neck squamous cell carcinoma (HNSC), kidney renal cell carcinoma (KIRC), lung adenocarcinoma (LUAD), lung squamous cell carcinoma (LUSC), and uterine corpus endometrial carcinoma (UCEC).

Figure 2. Differentially expressed lncRNAs across 8 cancer types. (A) Number of upregulated (white) and down-regulated (black) lncRNAs that are differentially expressed between paired tumor and adjacent normal samples within each cancer type. (B) Number of cancer types that each lncRNA is differentially expressed in. (C) Average tumor expression (FPKM) for up-regulated lncRNAs. For lncRNAs differentially expressed in multiple cancers, each lncRNA-cancer pair is counted separately.
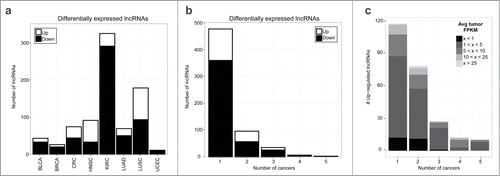
Figure 2. Differentially expressed lncRNAs across 8 cancer types. (A) Number of upregulated (white) and down-regulated (black) lncRNAs that are differentially expressed between paired tumor and adjacent normal samples within each cancer type. (B) Number of cancer types that each lncRNA is differentially expressed in. (C) Average tumor expression (FPKM) for up-regulated lncRNAs. For lncRNAs differentially expressed in multiple cancers, each lncRNA-cancer pair is counted separately.

Figure 3. Recurrently altered lncRNAs across 8 cancer types. (A) Heatmap showing well-characterized lncRNAs and onco-lncRNAs that are altered in 4 or more cancer types (red = upregulated, orange = up-regulated and outlier, blue = downregulated, magenta = down-regulated and outlier, gray = outlier). The top panel shows previously characterized lncRNAs and which TCGA cohorts they are altered in. The bottom panel highlights onco-lncRNAs altered in 4 or more cancer types. Boxplots showing expression levels (FPKM) of (B) onco-lncRNA-1 and (C) onco-lncRNA-21 for normal samples (N), tumor samples with a matched normal (T), and unpaired tumor samples (UT) across all 8 cancer types. Red boxes highlight upregulated cancer types and blue boxes highlight downregulated cancer types.
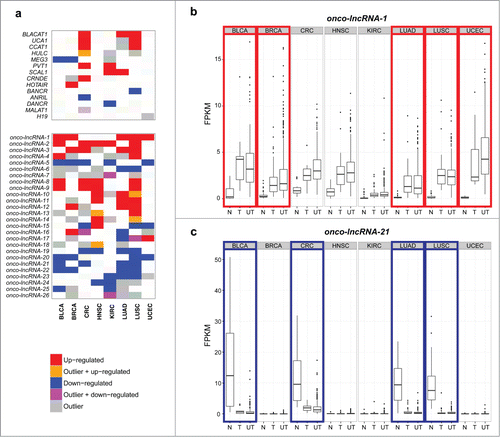
Figure 3. Recurrently altered lncRNAs across 8 cancer types. (A) Heatmap showing well-characterized lncRNAs and onco-lncRNAs that are altered in 4 or more cancer types (red = upregulated, orange = up-regulated and outlier, blue = downregulated, magenta = down-regulated and outlier, gray = outlier). The top panel shows previously characterized lncRNAs and which TCGA cohorts they are altered in. The bottom panel highlights onco-lncRNAs altered in 4 or more cancer types. Boxplots showing expression levels (FPKM) of (B) onco-lncRNA-1 and (C) onco-lncRNA-21 for normal samples (N), tumor samples with a matched normal (T), and unpaired tumor samples (UT) across all 8 cancer types. Red boxes highlight upregulated cancer types and blue boxes highlight downregulated cancer types.

Figure 4. Association between onco-lncRNA-1 expression and TP53 mutational status. Plots showing expression levels (FPKM) of onco-lncRNA-1 for BRCA (left), LUAD (middle), and UCEC (right). Gray points correspond to TP53 mutated samples and black points correspond to TP53 wild type (WT) samples. Samples are ordered on the x-axis by expression within each group. Black and gray horizontal lines display the median expression across each group. P-values for each mutational association are also reported (* FDR< 0.05, ** FDR < 0.01).

Figure 4. Association between onco-lncRNA-1 expression and TP53 mutational status. Plots showing expression levels (FPKM) of onco-lncRNA-1 for BRCA (left), LUAD (middle), and UCEC (right). Gray points correspond to TP53 mutated samples and black points correspond to TP53 wild type (WT) samples. Samples are ordered on the x-axis by expression within each group. Black and gray horizontal lines display the median expression across each group. P-values for each mutational association are also reported (* FDR< 0.05, ** FDR < 0.01).

Figure 5. Prediction of onco-lncRNA biological function. (A) Heatmap of functional predictions for lncRNAs differentially expressed in multiple cancers. Onco-lncRNAs are on the x-axis and GSEA functional concepts are on the y-axis. For each onco-lncRNA and functional gene set pair, a GSEA normalized enrichment score (NES) was calculated. Red represents a significant positive association, blue represents a significant negative association, and white represents no significant association. The black boxes highlight 3 distinct clusters of gene sets. (B) Top gene sets, as determined by average absolute NES, contained within each cluster from the heatmap.
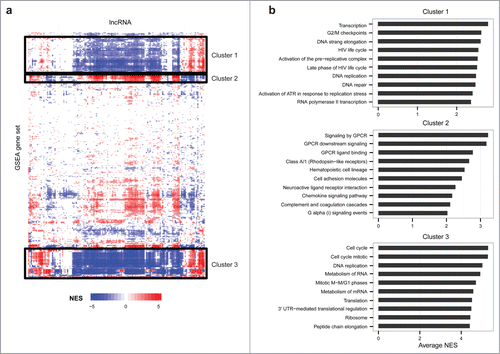
Figure 5. Prediction of onco-lncRNA biological function. (A) Heatmap of functional predictions for lncRNAs differentially expressed in multiple cancers. Onco-lncRNAs are on the x-axis and GSEA functional concepts are on the y-axis. For each onco-lncRNA and functional gene set pair, a GSEA normalized enrichment score (NES) was calculated. Red represents a significant positive association, blue represents a significant negative association, and white represents no significant association. The black boxes highlight 3 distinct clusters of gene sets. (B) Top gene sets, as determined by average absolute NES, contained within each cluster from the heatmap.

Figure 6. CCAT1 regulates cell growth in lung cancer. (A) Boxplots showing expression levels (FPKM) of CCAT1 for normal samples (N), tumor samples with a matched normal (T), and unpaired tumor samples (UT) across all 8 cancer types. Red boxes highlight up-regulated cancer types and the yellow box highlights the outlier cancer type. (B) GSEA normalized enrichment scores (NES) for cell cycle related gene sets. (C) Cell growth assay in NCI-H322M cells using CCAT1 siRNAs (* P < 0.05 by a 2-tailed Student's t-test) and qPCR validation of CCAT1 siRNA knockdown. (D) Cell growth assay in NCI-H522 cells using CCAT1 siRNAs (** P < 0.01, # P < 0.001 by a 2-tailed Student's t-test) and qPCR validation of CCAT1 siRNA knockdown. All error bars are mean ± standard error of the mean across n = 3 biological replicates.
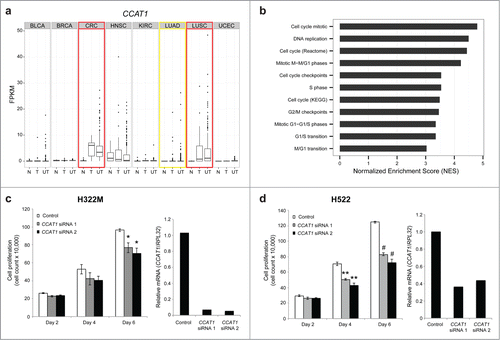
Figure 6. CCAT1 regulates cell growth in lung cancer. (A) Boxplots showing expression levels (FPKM) of CCAT1 for normal samples (N), tumor samples with a matched normal (T), and unpaired tumor samples (UT) across all 8 cancer types. Red boxes highlight up-regulated cancer types and the yellow box highlights the outlier cancer type. (B) GSEA normalized enrichment scores (NES) for cell cycle related gene sets. (C) Cell growth assay in NCI-H322M cells using CCAT1 siRNAs (* P < 0.05 by a 2-tailed Student's t-test) and qPCR validation of CCAT1 siRNA knockdown. (D) Cell growth assay in NCI-H522 cells using CCAT1 siRNAs (** P < 0.01, # P < 0.001 by a 2-tailed Student's t-test) and qPCR validation of CCAT1 siRNA knockdown. All error bars are mean ± standard error of the mean across n = 3 biological replicates.
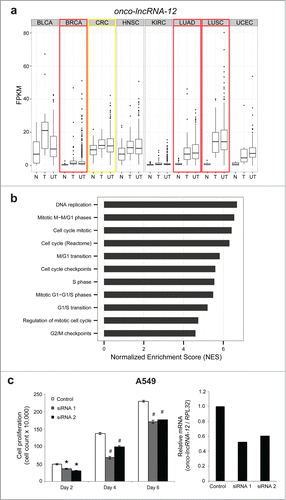
Figure 7. Onco-lncRNA-12 regulates cell growth. (A) Boxplots showing expression levels (FPKM) of onco-lncRNA-12 for normal samples (N), tumor samples with a matched normal (T), and unpaired tumor samples (UT) across all 8 cancer types. Red boxes highlight upregulated cancer types and the yellow box highlights the outlier cancer type. (B) GSEA normalized enrichment scores (NES) for cell cycle related gene sets. (C) Cell growth assay in A549 cells using onco-lncRNA-12 siRNAs (* P < 0.01, # P < 0.005 by a 2-tailed Student's t-test) and qPCR validation of onco-lncRNA-12 siRNA knockdown. All error bars are mean ± standard error of the mean across n = 3 biological replicates.

Figure 7. Onco-lncRNA-12 regulates cell growth. (A) Boxplots showing expression levels (FPKM) of onco-lncRNA-12 for normal samples (N), tumor samples with a matched normal (T), and unpaired tumor samples (UT) across all 8 cancer types. Red boxes highlight upregulated cancer types and the yellow box highlights the outlier cancer type. (B) GSEA normalized enrichment scores (NES) for cell cycle related gene sets. (C) Cell growth assay in A549 cells using onco-lncRNA-12 siRNAs (* P < 0.01, # P < 0.005 by a 2-tailed Student's t-test) and qPCR validation of onco-lncRNA-12 siRNA knockdown. All error bars are mean ± standard error of the mean across n = 3 biological replicates.
Supplemental material

Supplementary_files.zip

Download Zip (14.4 MB)