Figures & data
Figure 1. Schematic diagram of the pre-mRNA splicing reaction. Splicing factors and snRNPs are shown as ellipses and the pre-mRNA branchpoint adenosine is indicated as a circled “A.” Base pairing interactions between snRNAs and the pre-mRNA are denoted by short, vertical lines. Biochemically identified steps are indicated as “complex A,” “complex B,” etc.
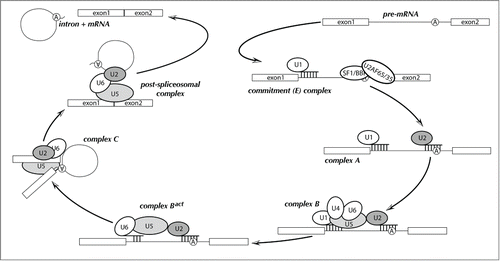
Figure 2. Schematic of eukaryotic relationships highlighting studies of splicing. Red dots indicate a lineage in which there has been extensive biochemical characterization of splicing factors and mechanisms. Clades containing organisms with reduced spliceosomes discussed in this review are in blue text with species names in parentheses: Cm - C. merolae, Ec - E. cuniculi, Gl - G. lamblia, Tb - T. brucei.
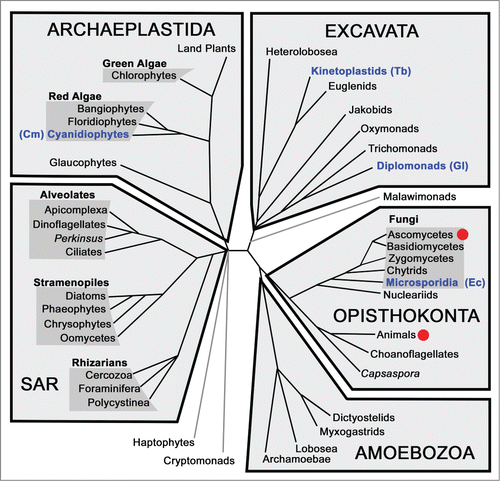
Table 1. Splicing protein complement of various organisms. Protein counts for the human spliceosome come from Agafonov,Citation3 those for C. merolae are from Stark,Citation1,7 and those for Giardia and for E. cuniculi come from Collins.Citation9.
Figure 3. Spliceosomal protein complement from various organisms. (following ref.Citation7) Proteins are divided up according to the snRNP or sub-particle with which they are associated. Protein orthologues conserved in humans and yeast (S. cerevisiae), but not C. merolae or G. lamblia, are in light gray font, while those additionally found in C. merolae are in blue, those in G. lamblia in orange. Proteins conserved in all four organisms are in black font.
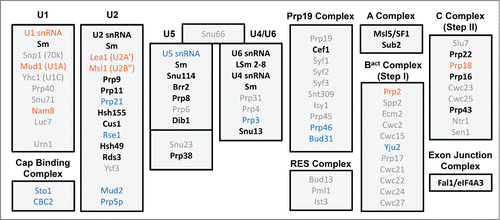
Figure 4. Secondary structures of major and minor spliceosomal snRNAs. (A) Consensus secondary structures and base pairing for the interaction between major U2/U6 and minor U12/U6atac spliceosomal snRNAs. Features distinctive of U2- and U12-dependent spliceosomes are indicated in gray boxes.(adapted from Hudson.Citation14) (B) Secondary structural predictions for the G. lamblia U2 and U6 snRNA interaction.Citation14 Conserved U2/U6 snRNA-snRNA intermolecular helices I to III are indicated, and important snRNA regions that bind intron elements or catalytic metal ions are boxed. ISL = intramolecular stem loop, SS = splice site.
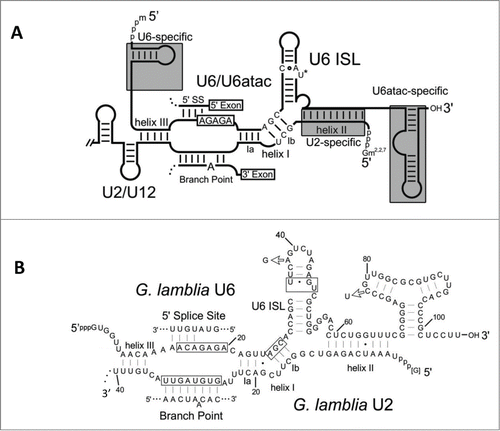
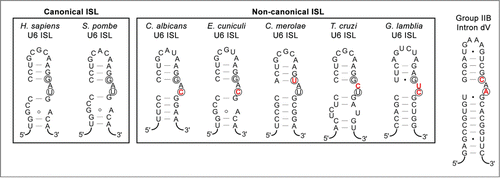
Figure 5. U6 snRNA intramolecular stem-loops (ISLs) compared to domain V of group II introns. Secondary structure predictions for canonical and non-canonical U6 ISLs from Homo sapiens,Citation50 Schizosaccharomyces pombe,Citation33 Candida albicans,Citation51 Encephalitozoon cuniculi,Citation15 Cyanidioschyzon merolae,Citation17 Trypanosoma cruzi,Citation52 and Giardia lamblia.Citation14 are compared to the P.li.LSUI2 group IIB intron from Pylaiella littoralis.Citation53 Nucleotides involved in Mg2+ binding are circled and nucleotides in the U6 ISL bulge region that differ from the eukaryotic consensus are indicated in red text.