1,694
Views
10
CrossRef citations to date
0
Altmetric
Research Paper

Studies on human eRF3-PABP interaction reveal the influence of eRF3a N-terminal glycin repeat on eRF3-PABP binding affinity and the lower affinity of eRF3a 12-GGC allele involved in cancer susceptibility

, , &
Pages 306-315 | Received 21 Sep 2015, Accepted 23 Dec 2015, Published online: 21 Feb 2016

Figures & data

Figure 1. SPR analysis of the interaction between eRF3 and PABP (2000–2200 RU) immobilized on a CM5 sensor chip surface. Typical experimental sensorgrams (top panels) and residual plots (difference between calculated and experimental data points, bottom panels) are shown for eRF3a 10-GGC allele (A), eRF3a 12-GGC allele (B), eRF3a 7-GGC allele (C), eRF3a 11-GGC allele (D), and eRF3b (E). The different concentrations of the injected analytes are indicated on the right of the sensorgrams (for experimental details see Materials and Methods). Data were treated and integrated using a simple Langmuir 1:1 model. For each analyte concentration the fitted curve is shown in black. (F) Comparison of eRF3a alleles and eRF3b equilibrium dissociation constants (KD) listed in . Error bars indicate the standard error (SEM). Statistical significance (P-values from unpaired Student's t-test) of differences between eRF3a 12-GGC and other eRF3a alleles are indicated.
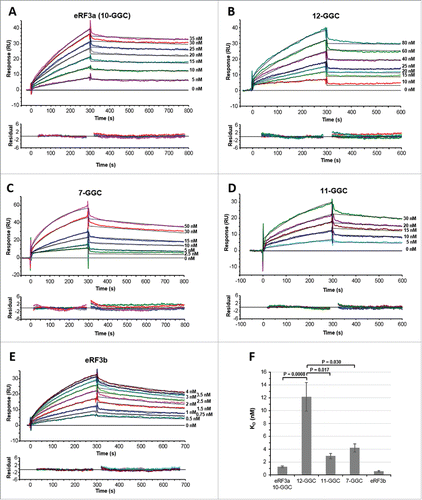
Figure 1. SPR analysis of the interaction between eRF3 and PABP (2000–2200 RU) immobilized on a CM5 sensor chip surface. Typical experimental sensorgrams (top panels) and residual plots (difference between calculated and experimental data points, bottom panels) are shown for eRF3a 10-GGC allele (A), eRF3a 12-GGC allele (B), eRF3a 7-GGC allele (C), eRF3a 11-GGC allele (D), and eRF3b (E). The different concentrations of the injected analytes are indicated on the right of the sensorgrams (for experimental details see Materials and Methods). Data were treated and integrated using a simple Langmuir 1:1 model. For each analyte concentration the fitted curve is shown in black. (F) Comparison of eRF3a alleles and eRF3b equilibrium dissociation constants (KD) listed in Table 1. Error bars indicate the standard error (SEM). Statistical significance (P-values from unpaired Student's t-test) of differences between eRF3a 12-GGC and other eRF3a alleles are indicated.

Table 1. Kinetic parameters for eRF3a alleles and eRF3b interaction with PABP immobilized on a CM5 sensor chip surface.aFootnotea

Figure 2. Kinetic analyses of PABP binding to 5′ biotinylated OligoA120 RNA (220 RU) immobilized onto a SA sensor chip surface. (A) Sensorgrams of the binding profiles using a Langmuir 1:1 binding model (top panel) and residuals plots (bottom panel) are shown. Concentrations of PABP injected are indicated on the right of the sensorgrams. Kinetic parameters (ka, kd and KD) and the Chi2 value of the fitting are also indicated. (B) Plot of the response vs. PABP concentration used for the steady-state affinity fitting with the BIAevaluation software (see text for details).
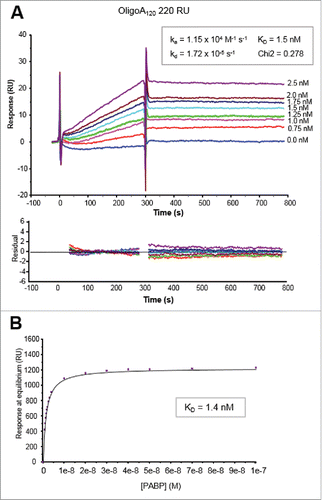
Figure 2. Kinetic analyses of PABP binding to 5′ biotinylated OligoA120 RNA (220 RU) immobilized onto a SA sensor chip surface. (A) Sensorgrams of the binding profiles using a Langmuir 1:1 binding model (top panel) and residuals plots (bottom panel) are shown. Concentrations of PABP injected are indicated on the right of the sensorgrams. Kinetic parameters (ka, kd and KD) and the Chi2 value of the fitting are also indicated. (B) Plot of the response vs. PABP concentration used for the steady-state affinity fitting with the BIAevaluation software (see text for details).

Figure 3. Sensorgrams of single-binding analysis of eRF3a and 7-GGC, 11-GGC, and 12-GGC alleles. eRF3a alleles were injected at 10 and 20 nM concentrations (indicated on the right of each sensorgram) over PABP (300 RU) bound to OligoA120 RNA (30 RU) immobilized on a SA sensor chip.
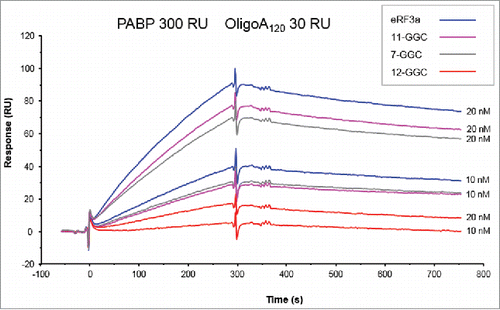
Figure 3. Sensorgrams of single-binding analysis of eRF3a and 7-GGC, 11-GGC, and 12-GGC alleles. eRF3a alleles were injected at 10 and 20 nM concentrations (indicated on the right of each sensorgram) over PABP (300 RU) bound to OligoA120 RNA (30 RU) immobilized on a SA sensor chip.

Figure 4. Kinetic analyses of eRF3a 10-GGC allele (A) and eRF3a 12-GGC allele (B) interacting with PABP (300 RU) bound to OligoA120 RNA (30 RU) immobilized onto a SA sensor chip surface. Typical sensorgrams and fitting of the binding profiles to a Langmuir 1:1 binding model (top panel) and residuals plots (bottom panel) are shown. Concentrations of injected analytes are indicated on the right of the sensorgrams. For each analyte concentration the fitted curve is shown in black.
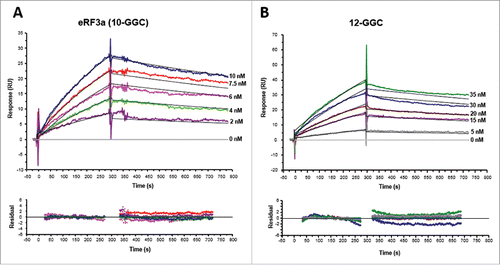
Figure 4. Kinetic analyses of eRF3a 10-GGC allele (A) and eRF3a 12-GGC allele (B) interacting with PABP (300 RU) bound to OligoA120 RNA (30 RU) immobilized onto a SA sensor chip surface. Typical sensorgrams and fitting of the binding profiles to a Langmuir 1:1 binding model (top panel) and residuals plots (bottom panel) are shown. Concentrations of injected analytes are indicated on the right of the sensorgrams. For each analyte concentration the fitted curve is shown in black.

Table 2. Kinetic parameters for eRF3a and eRF3a 12-GGC allele interaction with PABP bound to OligoA120 immobilized on a SA sensor chip surface.aFootnotea

Table 3. eRF3a allele frequencies in human population.

Supplemental material

Supplemental_Figure1-6.doc

Download MS Word (842.5 KB)