1,167
Views
3
CrossRef citations to date
0
Altmetric
Research Paper

The cytoplasmic mRNA degradation factor Pat1 is required for rRNA processing

, &
Pages 455-465 | Received 11 Dec 2015, Accepted 09 Feb 2016, Published online: 28 Mar 2016

Figures & data

Figure 1. Deletion of Pat1 does not affect splicing of pre-U3 snoRNA. (A) Strains indicated were grown overnight at 30°C. Cells were then serially diluted 1:10, spotted on YEPD plates and grown at the indicated temperatures. (B) Northern analysis of the pre-U3 snoRNA splicing on a 6% denaturing polyacrylamide gel, blotted, and hybridized with oligonucleotide probe complementary U3 RNA. The unspliced U3 RNA is indicated as “Pre-U3 Species.” The mature and truncated U3 species are also indicated. scR1 is the loading control.
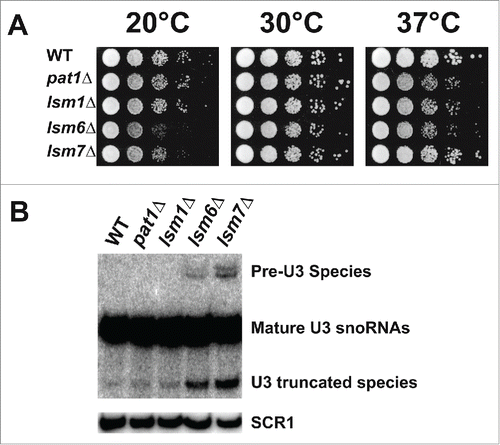
Figure 1. Deletion of Pat1 does not affect splicing of pre-U3 snoRNA. (A) Strains indicated were grown overnight at 30°C. Cells were then serially diluted 1:10, spotted on YEPD plates and grown at the indicated temperatures. (B) Northern analysis of the pre-U3 snoRNA splicing on a 6% denaturing polyacrylamide gel, blotted, and hybridized with oligonucleotide probe complementary U3 RNA. The unspliced U3 RNA is indicated as “Pre-U3 Species.” The mature and truncated U3 species are also indicated. scR1 is the loading control.

Figure 2. Deletion of Pat1 does not accumulate 5′-unprocessed fragments of pre-mRNAs having intronic snoRNAs. (A) Pictorial representation of an mRNA containing snoRNA in its intronic region, showing the relative positions of the oligonucleotide probes used in this study. (B) Left: Northern analysis of the TEF4 mRNA indicating 5′ decay product, the snR38 snoRNA and spliced full-length TEF4. To the left of each gel panel is indicated in brackets the oligonucleotide used for probing. The strains used are indicated above the figure. Total RNA was analyzed by agarose or PAGE northern analysis as appropriate. Right: The splicing products and decay intermediates are schematically depicted next to the indicated RNA species on the left. (C) As above for the EFB1 gene. (D) Northern analysis for the ACT1 gene in the strains indicated above probed with randomly primed DNA. (E) As above for the PGK1 gene. (F) As above for the SCR1 gene and probed with oTN100 (G) Quantification of the relative percentages of the mature mRNA and snoRNA of EFB1 and TEF4 normalized to scR1. The data represents averages of at least 3 independent experiments, Error = SD. Two tailed independent sample t-test with unequal variance was used. * Indicates p-values of < 0.05, ** indicates p-values of < 0.01, and *** indicates p-values of < 0.001. (H) Quantification of the relative percentages of the PGK1 and ACT1 mRNA normalized to scR1.
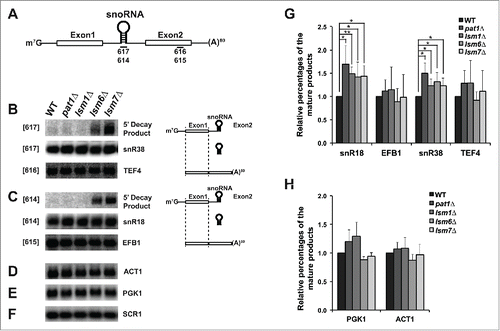
Figure 2. Deletion of Pat1 does not accumulate 5′-unprocessed fragments of pre-mRNAs having intronic snoRNAs. (A) Pictorial representation of an mRNA containing snoRNA in its intronic region, showing the relative positions of the oligonucleotide probes used in this study. (B) Left: Northern analysis of the TEF4 mRNA indicating 5′ decay product, the snR38 snoRNA and spliced full-length TEF4. To the left of each gel panel is indicated in brackets the oligonucleotide used for probing. The strains used are indicated above the figure. Total RNA was analyzed by agarose or PAGE northern analysis as appropriate. Right: The splicing products and decay intermediates are schematically depicted next to the indicated RNA species on the left. (C) As above for the EFB1 gene. (D) Northern analysis for the ACT1 gene in the strains indicated above probed with randomly primed DNA. (E) As above for the PGK1 gene. (F) As above for the SCR1 gene and probed with oTN100 (G) Quantification of the relative percentages of the mature mRNA and snoRNA of EFB1 and TEF4 normalized to scR1. The data represents averages of at least 3 independent experiments, Error = SD. Two tailed independent sample t-test with unequal variance was used. * Indicates p-values of < 0.05, ** indicates p-values of < 0.01, and *** indicates p-values of < 0.001. (H) Quantification of the relative percentages of the PGK1 and ACT1 mRNA normalized to scR1.

Figure 3. Pat1 is required for rRNA maturation. (A) Schematic representation of pre-35S rRNA and the relative positions of the oligonucleotide probes used for northern analysis. (B) Northern analysis of rRNA processing. The oligonucleotide probes used for probing are indicated in the brackets. RNA products analyzed are indicated to the right. The rRNA species are schematically depicted next to the indicated rRNA products. Strains examined are indicated at the top of the panels. (C) Quantification of rRNA intermediates shown in panel B normalized to scR1. n = 3, Error bar = SD and p-values as indicated in Pulse-chase analysis of WT and pat1Δ strains. Strains were pulse-labeled for 1 min and chased with unlabeled uracil for the indicated times listed above. The pre-rRNAs and rRNAs are indicated on the left and the schematic representation of rRNA species is on the right. (E) Growth assay for the WT, single, and double deletion strains indicated in the figure. Cells were grown overnight, serially diluted, spotted on YEPD plates and grown at the given temperatures.
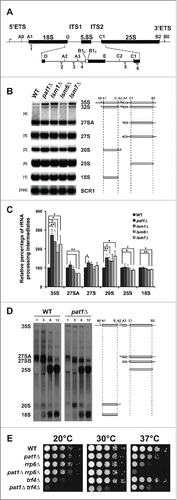
Figure 3. Pat1 is required for rRNA maturation. (A) Schematic representation of pre-35S rRNA and the relative positions of the oligonucleotide probes used for northern analysis. (B) Northern analysis of rRNA processing. The oligonucleotide probes used for probing are indicated in the brackets. RNA products analyzed are indicated to the right. The rRNA species are schematically depicted next to the indicated rRNA products. Strains examined are indicated at the top of the panels. (C) Quantification of rRNA intermediates shown in panel B normalized to scR1. n = 3, Error bar = SD and p-values as indicated in Fig. 2 (D) Pulse-chase analysis of WT and pat1Δ strains. Strains were pulse-labeled for 1 min and chased with unlabeled uracil for the indicated times listed above. The pre-rRNAs and rRNAs are indicated on the left and the schematic representation of rRNA species is on the right. (E) Growth assay for the WT, single, and double deletion strains indicated in the figure. Cells were grown overnight, serially diluted, spotted on YEPD plates and grown at the given temperatures.

Table 1. Relative amounts of rRNA processing intermediates in pat1 and lsm mutants.

Figure 4. Domains of Pat1 that are required for mRNA decapping are also required for rRNA processing. (A) Growth of different truncation mutants of Pat1. Constructs containing different domains of Pat1 were transformed into pat1Δ mutant. Strains were grown in SDC–Ura medium overnight at 30°C. Cells were serially diluted 1:10, spotted on SDC–Ura plates and grown at the temperatures indicated. (B) In vivo mRNA decapping efficiency of Pat1 truncation mutants grown. Northern blots were probed for the MFA2pG gene with oTN121. The relative percentage of pG decay fragment to full-length MFA2pG is indicated. n = 3, Error bars and p-values as in rRNA processing in the Pat1 truncation mutants. Northern analysis performed as panel B. n = 3. The oligonucleotide probes used for probing are indicated in the brackets to the left. rRNA processing intermediates are indicated to the right. The relative amounts of the rRNA intermediates is given at the bottom of the each panel, corresponding to the order of the species on the rRNA northern, with the species in parenthesis given next to it. The schematic representation of the rRNA processing intermediates is depicted to the right of the indicated rRNA species. (D) Pat1 mutants are sensitive to 6-AU. Growth of the pat1 mutants was analyzed as in panel A. Cells were spotted on SDC–Ura plates or SDC–Ura+ 6-AU (50ug/ml) plates.
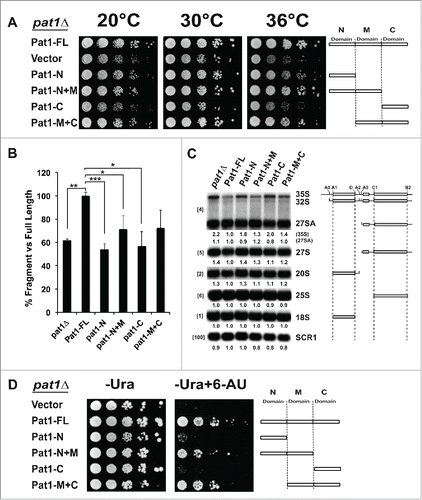
Figure 4. Domains of Pat1 that are required for mRNA decapping are also required for rRNA processing. (A) Growth of different truncation mutants of Pat1. Constructs containing different domains of Pat1 were transformed into pat1Δ mutant. Strains were grown in SDC–Ura medium overnight at 30°C. Cells were serially diluted 1:10, spotted on SDC–Ura plates and grown at the temperatures indicated. (B) In vivo mRNA decapping efficiency of Pat1 truncation mutants grown. Northern blots were probed for the MFA2pG gene with oTN121. The relative percentage of pG decay fragment to full-length MFA2pG is indicated. n = 3, Error bars and p-values as in Fig. 2 (C) rRNA processing in the Pat1 truncation mutants. Northern analysis performed as panel B. n = 3. The oligonucleotide probes used for probing are indicated in the brackets to the left. rRNA processing intermediates are indicated to the right. The relative amounts of the rRNA intermediates is given at the bottom of the each panel, corresponding to the order of the species on the rRNA northern, with the species in parenthesis given next to it. The schematic representation of the rRNA processing intermediates is depicted to the right of the indicated rRNA species. (D) Pat1 mutants are sensitive to 6-AU. Growth of the pat1 mutants was analyzed as in panel A. Cells were spotted on SDC–Ura plates or SDC–Ura+ 6-AU (50ug/ml) plates.

Figure 5. RB-related mRNAs are upregulated in pat1 deletion mutant. Quantification of the northern analysis of the mRNAs belonging to different classes of differentially expressed mRNAs in pat1Δ mutant from Sun et al. Citation17 normalized to SCR1 RNA. Total RNA from WT and pat1Δ strains grown at 30°C to 0.5 O.D was extracted and separated on a 1.2 % agarose gel. mRNAs indicated in the X-axis were probed with randomly primed probes made with primers listed in Table S3. Y-axis is plotted in log2 scale. Different categories of mRNAs from Sun et al. Citation17 examined in this study are indicated at the bottom of the graph. n = 3, Error bar = SD and p-values as given in .
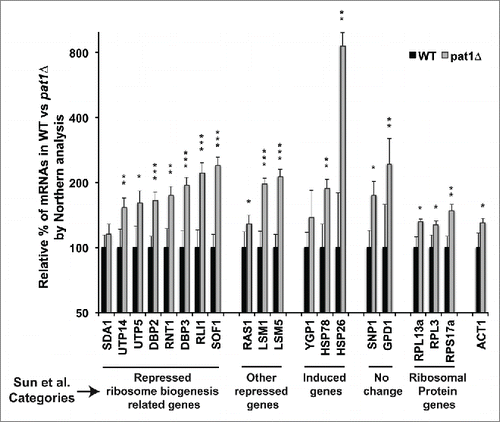
Figure 5. RB-related mRNAs are upregulated in pat1 deletion mutant. Quantification of the northern analysis of the mRNAs belonging to different classes of differentially expressed mRNAs in pat1Δ mutant from Sun et al. Citation17 normalized to SCR1 RNA. Total RNA from WT and pat1Δ strains grown at 30°C to 0.5 O.D was extracted and separated on a 1.2 % agarose gel. mRNAs indicated in the X-axis were probed with randomly primed probes made with primers listed in Table S3. Y-axis is plotted in log2 scale. Different categories of mRNAs from Sun et al. Citation17 examined in this study are indicated at the bottom of the graph. n = 3, Error bar = SD and p-values as given in Fig. 2.
Supplemental material

Supplemental_Data.pdf

Download PDF (64.9 MB)

Reprints and Corporate Permissions

Please note: Selecting permissions does not provide access to the full text of the article, please see our help page How do I view content?

To request a reprint or corporate permissions for this article, please click on the relevant link below:

Academic Permissions

Please note: Selecting permissions does not provide access to the full text of the article, please see our help page How do I view content?

Obtain permissions instantly via Rightslink by clicking on the button below:

If you are unable to obtain permissions via Rightslink, please complete and submit this Permissions form. For more information, please visit our Permissions help page.