Figures & data
Figure 1. MiR-Seq analysis of miRNA expression changes with pressure overload (TAC) and treatment with antimiR-34. (A) Percentage of total reads mapped to non-coding small RNAs and other RNA species identified by deep sequencing. (B) 2D Principal Component analysis plot of 313 miRNAs in Sham control, Sham antimiR-34, TAC control and TAC antimiR-34 hearts. (C) Results of SOM clustering analysis, showing 6 distinct patterns of miRNA expression in heart samples. Vertical scale indicates normalization of mean intensity reads. (D) Work flow of sequencing reads, processing, bioinformatic data analyses and selection of miRNAs of interest.
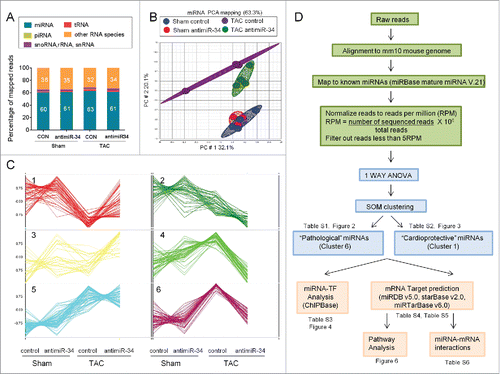
Figure 2. “Pathological” miRNAs are upregulated in TAC control vs. Sham control, and their upregulation blunted in TAC antimiR-34 versus TAC control. Left: Heat map of mean expression levels for 60 “pathological” miRNAs from Cluster 6, Right: MiRNA-Seq normalized read counts for the top 9 “pathological” miRNAs. *p < 0.05 vs. Sham of the same treatment, †p < 0.05 by 1 way ANOVA and Fisher post hoc test. n = 3–4/group. Data is presented as mean ± SEM.
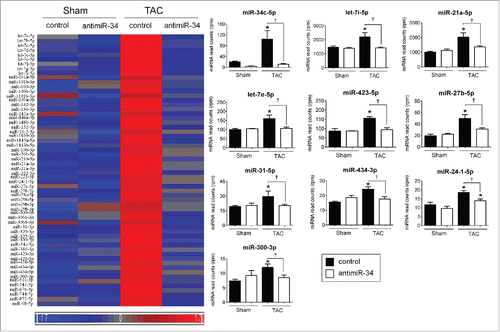
Table 1. “Pathological” and “cardioprotective” miRNAs significantly correlated with HW/TL ratio of Sham control, Sham antimiR-34, TAC control and TAC antimiR-34 mice.
Figure 3. “Cardioprotective” miRNAs are repressed in TAC control vs. Sham control, and restored, at least partially, with TAC antimiR-34 versus TAC control. Left: Heat map of mean expression levels for 57 “cardioprotective” miRNAs from Cluster 1, Right: MiRNA-Seq normalized read counts for the top 5 “cardioprotective” miRNAs. *p < 0.05 vs. Sham of the same treatment, †p < 0.05 by 1 way ANOVA and Fisher post hoc test. n = 3–4/group. Data is presented as mean ± SEM.
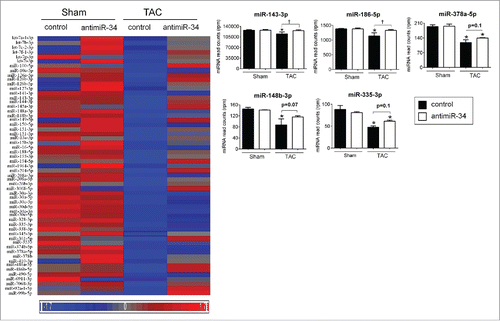
Figure 4. TF-miRNA regulatory network. A total of 134 TF-miRNA interactions involving 45 TF and 14 miRNAs were collected for this network. V-shaped nodes correspond to the miRNAs, red V-shaped nodes are “pathological” miRNAs and green V-shaped nodes are “cardioprotective” miRNAs. The oval nodes represent TFs, while purple oval nodes represent validated miR-34 targets. TF binding sites were determined from ChIP-Seq data from miRNA promoters (defined as 5kb upstream and 1kb downstream) as defined from ChIPBase. Verified miR-34 targets are based on previous experimental reports.
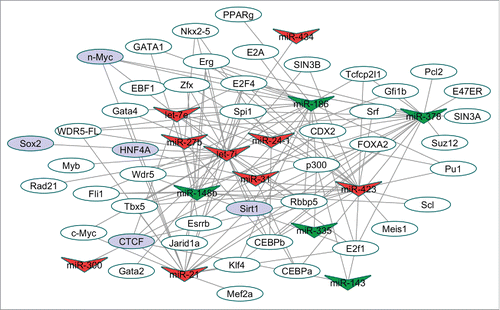
Figure 5. The transcription factor, CTCF, regulates let-7e and miR-31 (A) qPCR for CTCF in H9c2 cells transfected with CTCF siRNA or negative control siRNA (neg siRNA). N = 3/group *p < 0.05 vs. neg siRNA by unpaired t-test. qPCR for (B) let-7e and (C) miR-31 in H9c2 cells transfected with CTCF siRNA or neg siRNA, N = 3/group, *p < 0.05 vs. neg siRNA by unpaired t-test. Data is presented as mean ± SEM.
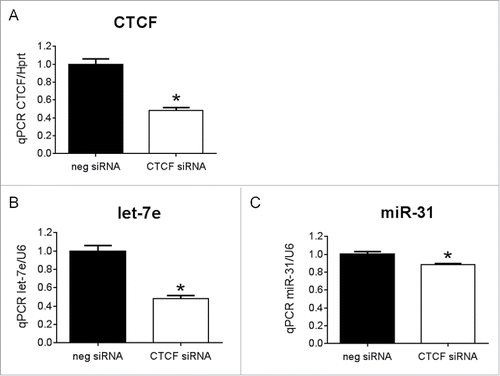
Figure 6. The target genes of “pathological” and “cardioprotective” miRNAs are enriched for common and distinct functional pathways. Enriched pathways targeted by “pathological” miRNAs are shown in red, while pathways enriched for mRNA targets of “cardioprotective” miRNAs are shown in green.
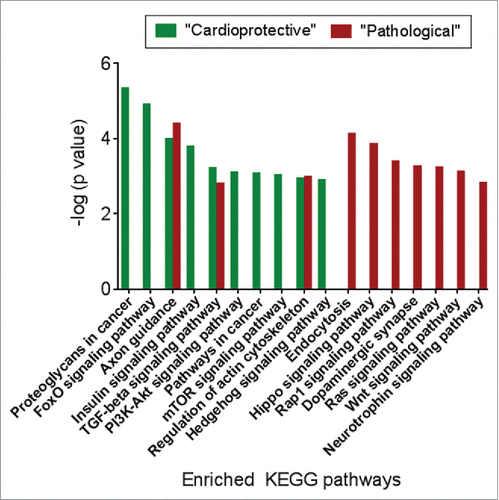
Figure 7. Secondary miRNAs regulated by inhibiting miR-34 have targets common to miR-34. (A) Linear correlation between let-7e expression and HW/TL ratios and fractional shortening, p < 0.05 for all correlations, (B) qPCR of let-7e and miR-31 in hearts of TAC control and TAC antimiR-34 treated mice. N = 6/group *p < 0.05 vs. TAC control by unpaired t-test. (C) qPCR of let-7e and miR-31 in hearts of TAC control and TAC antimiR-34 treated mice. N = 4–5/group. CON-control. (D) Venn diagram of common predicted targets for miR-34, let-7e and miR-31. (E) qPCR of Acsl4 in hearts of TAC control and TAC antimiR-34 treated mice. N = 6 = 8/group *p < 0.05 vs. TAC control by unpaired t-test. Data is presented as mean ± SEM.
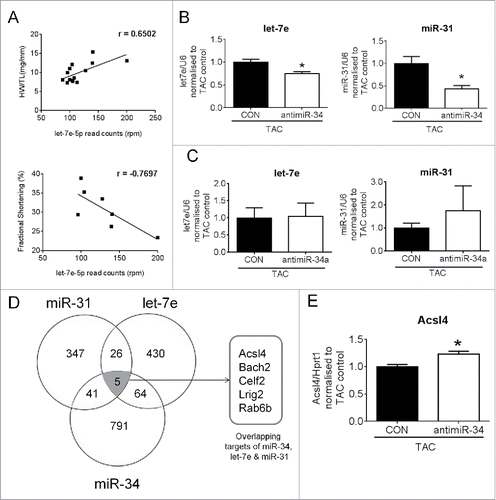
Figure 8. Summary Figure- AntimiR-34 therapy regulates secondary miRNAs via interactions with TFs, and secondary miRNAs have effects via targets common and distinct to miR-34. MRNA targets of secondary miRNAs that are common to miR-34 are shown in blue, and mRNA targets specific to secondary miRNAs are in black.
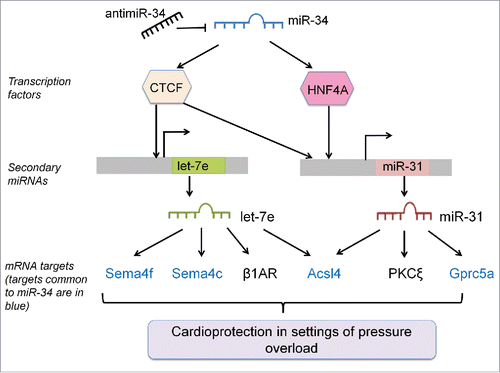
Table 2. List of “pathological” miRNAs (upregulated during TAC and decreased in TAC LNA-antimiR34 treatment) and their role in the heart based on previous reports.
Table 3. List of “cardioprotective” miRNAs (decreased during TAC and upregulated in TAC LNA-antimiR34 treatment) and their role in the heart based on previous reports.
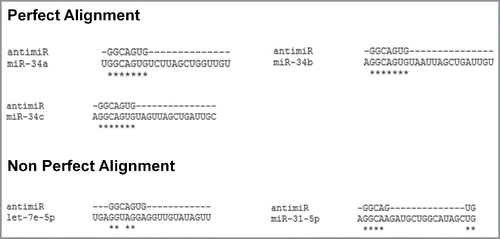
Figure 9. Alignment of antimiR-34 with sequences of the miR-34 family (a,b,c) and “secondary” miRNAs (let-7e and miR-31). * highlight exact alignment between sequences.