Figures & data
Figure 1. Consequences of a mechanistic connection between APA and AS events upstream of the terminal exon. It is unknown whether APA and AS events are functionally coupled beyond the definition of the terminal exon. If the RNA processing events are uncoupled (left arm) mRNA isoforms generated through AS would not display a selective preference for a particular APA event. A coupled event (right arm) would preferentially associate one form of APA with a specific AS event. The alternatively spliced exon is depicted in purple, introns shown as black lines, distal poly(A) (pA) site shown in brown, and the proximal pA site is depicted in orange.
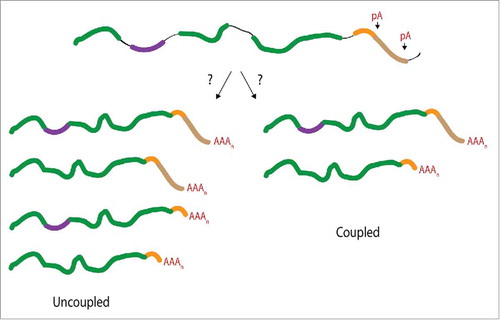
Figure 2. CF1m25 KD induces APA leading to increased last intron retention in TIMP-2. (A) Western blot illustrating the efficiency of CF1m25 KD in HeLa cells. (B) Diagram of primers used for 3′ RACE amplification of TIMP-2. The distal primer binds to the 3′ UTR sequence of the 3.8 kb mRNA isoform. The proximal primer binds to the coding sequence of TIMP-2 but amplifies only from the poly(A) tail of the 1.2 kb isoform. (C) 3′ RACE cDNA amplification of TIMP-2 from cells transfected with CF1m25 shRNA or a negative control vector. The identities of the amplified PCR products are indicated on the side of the representative gel. The results of independent experiments are displayed in the graph below as the ratio of proximal:distal poly(A) site usage. (D) Diagram of PCR primers flanking the terminal intron retention event in TIMP-2. Asterisk (*) denotes non-specific binding. (E) RT-PCR analysis of TIMP-2 intron retention in cells treated with CF1m25 shRNA or control shRNA. The unspliced and spliced products amplified are indicated on the left of the representative gel. The results of independent experiments are displayed in the graph as the ratio of unspliced:spliced.
Figure 3. Genome-wide approach for identification of a larger sample pool for correlation studies. (A) Western blot demonstrating CstF64 KD in HeLa cells. (B) Workflow for genome-wide analysis of CstF64 KD. To identify examples of APA genes, PAS-Seq and RNA deep sequencing was performed on both CstF64 KD and wild-type HeLa cells. APA and AS genes were then identified and the genes from each group were compared to each other to identify any overlap. (C) Fold change of the ratio of distal to proximal poly(A) sites between CstF64 KD and wild-type (WT) HeLa cells depicted for 10 genes identified by PAS-Seq, as determined by RT-qPCR, n = 3, *p < 0.05. Purple bars depict APA shifts from distal to proximal and green bars show proximal to distal APA changes. (D) Fold change of the ratio of distal to proximal poly(A) sites between CstF64 KD and WT HeLa cells depicted for 8 genes identified by MISO, as determined by qPCR, n = 3, *p<0.05. (E) Alternative splicing analysis identifies CstF64 as a potential regulator of AS. Alternative splicing analysis of RNA-Seq data identified a large number of significant AS changes upon CstF64 KD in HeLa cells (1,060 genes), indicating CstF64 as potential regulator of AS. (F) Overlap between AS and APA genes. Out of the 1,060 AS genes that were identified and 251 APA genes, only 13 genes were contained in the list of APA genes. (G) Number of CstF64 KD induced genes with intron retention located at the terminal intron (maroon) or upstream of the terminal intron (blue).
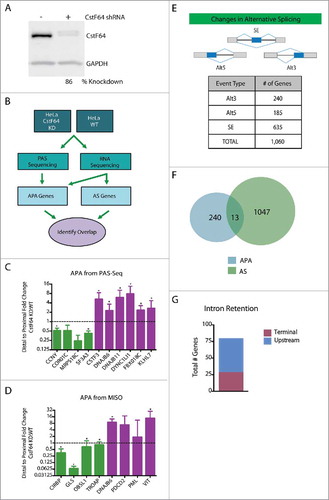
Figure 4. Density distribution of CstF64 binding in the vicinity of AS exons. To distinguish the location of intronic binding of CstF64, iCLIP-Seq coverage was analyzed. The density of the distribution of normalized iCLIP-Seq coverage within introns surrounding alternative exons was determined. (A) Intronic CstF64 binding distribution upstream of an alternatively spliced 3′ splice site (Alt3). (B) Intronic CstF64 binding distribution downstream of an alternatively spliced 5′ splice site (Alt5). (C) Intronic CstF64 binding distribution upstream of an alternatively skipped exon. (D) Intronic CstF64 binding distribution downstream of an alternatively skipped exon. “not differentially alternatively spliced” and “identically alternatively spliced” are control categories. The first control group includes exons that are not in the group of “differentially alternatively spliced” exons. The second control group (“identically alternatively spliced”) includes exons specifically filtered for no change in their splicing behavior. The plots show the fraction of events in those exon sets/groups that overlap with iCLIP-Seq clusters.
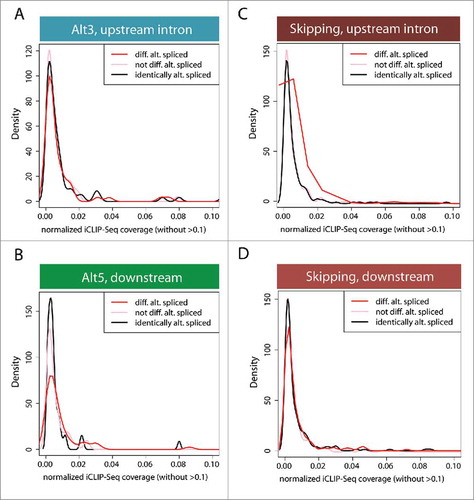
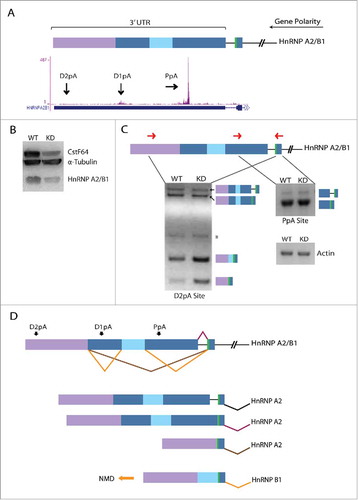
Figure 5. CstF64 binding within the 3′UTR of hnRNP A2/B1 gene triggers AS. (A) Cartoon depicts alternatively spliced regions (blue, light blue, purple boxes) located in the 3′UTR of the hnRNP A2/B1 gene. The polarity of the gene is from right (5′ end) to left (3′ end) as depicted by the long black arrow. The green bar depicts a stop codon. Snapshot from the UCSC genome browser depicts iCLIP-Seq track information for the binding of CstF64 and black arrows show the location of the proximal poly(A) site (PpA) and 2 distal poly(A) sites (D1pA and D2pA). (B) Western blot analysis demonstrating loss in hnRNP A2/B1 protein levels due to CstF64 KD. (C) RT-PCR analysis of the hnRNP A2/B1 3′UTR. Primer locations are depicted as forward and reverse red arrows. The identities of the PCR products are indicated on the side of the representative gels. Asterisk (*) denotes a non-specific amplicon. (D) Alternative splicing pattern in the 3′UTR of hnRNP A2/B1 depicting the generation of hnRNP B1 and hnRNP A2 mRNA isoforms. The orange arrow indicates the isoform (hnRNP B1) that undergoes nonsense-mediated decay (NMD).Citation41