924
Views
7
CrossRef citations to date
0
Altmetric
Research Paper

Ndt80 activates the meiotic ORC1 transcript isoform and SMA2 via a bi-directional middle sporulation element in Saccharomyces cerevisiae

, , , , &
Pages 772-782 | Received 08 Apr 2016, Accepted 13 May 2016, Published online: 05 Aug 2016

Figures & data

Figure 1. ORC1 isoform expression during growth and differentiation. (A) Color-coded heatmaps generated with RGV version 1.0, show DNA strand-specific Sc_tlg tiling array expression data ordered in rows for samples and columns for each oligonucleotide probe (blue is low, red is high; bicolor pivot 3.9 on the log scale). The strain background is shown to the right in red, time points are given in minutes to the left. A schematic represents the loci (shades of blue for ORFs and SUT, green for the UTR, and red for XUT) on both DNA strands (black lines). Arrows indicate transcription start sites. Note that the data shown, which cover one mitotic cycle, are part of a larger experiment reported in reference.Citation24 (B) A heatmap shows RNA-Sequencing data for 3 wild type strains (WT S288C, W303 and SK1) and corresponding strains lacking Xrn1 activity (xrn1) given to the left. All strains are haploid unless their DNA content is indicated (2n). Cells were cultured in YPD. The complete dataset was reported in reference.Citation5 (C) A heatmap like in panel A shows samples from diploid wild type cells cultured in rich media (YPD, YPA) and sporulation medium (SPII) taken at the time points indicated in hours (h). The strain is indicated to the right in green. Genome-wide data are from reference.Citation9 (D) A schematic summarizes the mitotic (top) and meiotic (bottom) expression profiles of SMA2 and ORC1 (dark and light blue rectangles, respectively) and the lncRNAs SUT292 and XUT1538 (blue and red rectangles). Transcripts are shown as wavy blue lines. Black lines represent the top and bottom DNA strands. Arrows indicate transcription start sites.
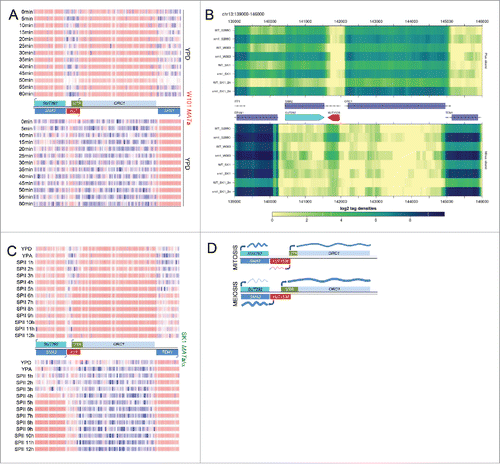
Figure 1. ORC1 isoform expression during growth and differentiation. (A) Color-coded heatmaps generated with RGV version 1.0, show DNA strand-specific Sc_tlg tiling array expression data ordered in rows for samples and columns for each oligonucleotide probe (blue is low, red is high; bicolor pivot 3.9 on the log scale). The strain background is shown to the right in red, time points are given in minutes to the left. A schematic represents the loci (shades of blue for ORFs and SUT, green for the UTR, and red for XUT) on both DNA strands (black lines). Arrows indicate transcription start sites. Note that the data shown, which cover one mitotic cycle, are part of a larger experiment reported in reference.Citation24 (B) A heatmap shows RNA-Sequencing data for 3 wild type strains (WT S288C, W303 and SK1) and corresponding strains lacking Xrn1 activity (xrn1) given to the left. All strains are haploid unless their DNA content is indicated (2n). Cells were cultured in YPD. The complete dataset was reported in reference.Citation5 (C) A heatmap like in panel A shows samples from diploid wild type cells cultured in rich media (YPD, YPA) and sporulation medium (SPII) taken at the time points indicated in hours (h). The strain is indicated to the right in green. Genome-wide data are from reference.Citation9 (D) A schematic summarizes the mitotic (top) and meiotic (bottom) expression profiles of SMA2 and ORC1 (dark and light blue rectangles, respectively) and the lncRNAs SUT292 and XUT1538 (blue and red rectangles). Transcripts are shown as wavy blue lines. Black lines represent the top and bottom DNA strands. Arrows indicate transcription start sites.

Figure 2. mORC1 induction requires sporulation. (A) (SPII, 4h, 6h, 8h). Tiling array data for ORC1 are shown as in for sporulation deficient SK1 MATα/α cells cultured in pre-sporulation medium (YPA) and sporulation medium (SPII, 4, 6, 8h). (B) A schematic shows the region containing the ORC1 locus as in . RNA-Sequencing data (not DNA strand-specific) are given as a color-coded histogram (IGV version 2.3.40 set at log scale data range min 0 and max 800) for cells cultured rich media in blue (YPD, YPA) and for sporulation medium in green (SPII) as shown to the left. The wild type (SK1 MATa/α in green) and sporulation deficient control strains (SK1 MATα/α in red) are indicated to the right.
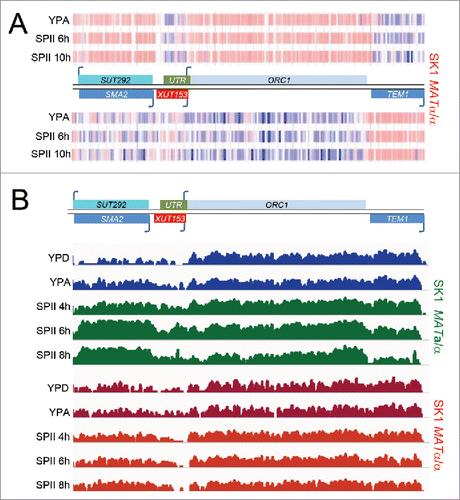
Figure 2. mORC1 induction requires sporulation. (A) (SPII, 4h, 6h, 8h). Tiling array data for ORC1 are shown as in Fig. 1 for sporulation deficient SK1 MATα/α cells cultured in pre-sporulation medium (YPA) and sporulation medium (SPII, 4, 6, 8h). (B) A schematic shows the region containing the ORC1 locus as in Fig. 1. RNA-Sequencing data (not DNA strand-specific) are given as a color-coded histogram (IGV version 2.3.40 set at log scale data range min 0 and max 800) for cells cultured rich media in blue (YPD, YPA) and for sporulation medium in green (SPII) as shown to the left. The wild type (SK1 MATa/α in green) and sporulation deficient control strains (SK1 MATα/α in red) are indicated to the right.

Figure 3. MSE prediction. (A) Logos of the predicted MSE (M01515) are shown as graphs plotting information content (y-axis) vs. position for each base in the sequence for forward (left) and reverse (right) DNA strands (x-axis). (B) A schematic represents the MSE in dark green, the 5′-UTR in light green and ORC1 in light blue. A black line represents the top DNA strand (+). The chromosome number is indicated. The base coordinates and the base composition of the 5′-mORC1 region, which contains a predicted MSE (bases are shown in red with the core bases enlarged and in bold), are shown at the bottom. (C) The predicted ORC1 MSE is aligned with the Sum1 target motif; a vertical line indicates base matches and similarities. Bases in the core sequence are given in red.
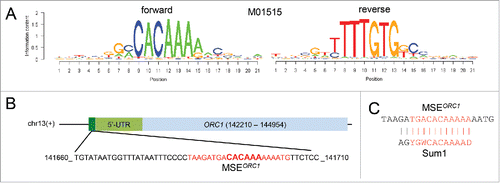
Figure 3. MSE prediction. (A) Logos of the predicted MSE (M01515) are shown as graphs plotting information content (y-axis) vs. position for each base in the sequence for forward (left) and reverse (right) DNA strands (x-axis). (B) A schematic represents the MSE in dark green, the 5′-UTR in light green and ORC1 in light blue. A black line represents the top DNA strand (+). The chromosome number is indicated. The base coordinates and the base composition of the 5′-mORC1 region, which contains a predicted MSE (bases are shown in red with the core bases enlarged and in bold), are shown at the bottom. (C) The predicted ORC1 MSE is aligned with the Sum1 target motif; a vertical line indicates base matches and similarities. Bases in the core sequence are given in red.

Figure 4. Ndt80-dependent mORC1/SMA2 expression. (A) A schematic shows the ORC1 5′-UTR in green and the ORF in light blue; > indicates the transcriptional direction. Small arrows symbolize oligonucleotide primers and black lines represent PCR products. Their coordinates with respect to the first base in the ATG start codon are given. The output of RT-PCR assays is shown for ORC1 isoforms (mORC1, ORC1) and ACT1. The wild type, ndt80 and sum1 strain backgrounds are shown to the left. Cells were harvested in rich media (YPD, YPA) and sporulation medium (SPII) at the bi-hourly time points indicated at the top. Two bar graphs show quantified signals from RT-PCR assays in panel A for mORC1 (top) and ORC1 (bottom) for the wild type (blue), sum1 (red) and ndt80 (green) strains given in the legends. Relative expression levels (y-axis) are plotted against samples (x-axis) as shown. Bars indicate the values obtained in duplicate experiments. (B) A schematic on top shows the SMA2 locus and the position of oligonucleotide primers (arrows) beneath a black line indicating the PCR fragment. The output of RT-PCR assays for SMA2 in wild type, ndt80 and sum1 strains is shown and bar diagrams are given as in panel A.
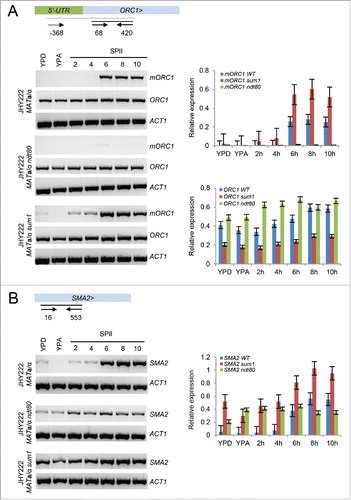
Figure 4. Ndt80-dependent mORC1/SMA2 expression. (A) A schematic shows the ORC1 5′-UTR in green and the ORF in light blue; > indicates the transcriptional direction. Small arrows symbolize oligonucleotide primers and black lines represent PCR products. Their coordinates with respect to the first base in the ATG start codon are given. The output of RT-PCR assays is shown for ORC1 isoforms (mORC1, ORC1) and ACT1. The wild type, ndt80 and sum1 strain backgrounds are shown to the left. Cells were harvested in rich media (YPD, YPA) and sporulation medium (SPII) at the bi-hourly time points indicated at the top. Two bar graphs show quantified signals from RT-PCR assays in panel A for mORC1 (top) and ORC1 (bottom) for the wild type (blue), sum1 (red) and ndt80 (green) strains given in the legends. Relative expression levels (y-axis) are plotted against samples (x-axis) as shown. Bars indicate the values obtained in duplicate experiments. (B) A schematic on top shows the SMA2 locus and the position of oligonucleotide primers (arrows) beneath a black line indicating the PCR fragment. The output of RT-PCR assays for SMA2 in wild type, ndt80 and sum1 strains is shown and bar diagrams are given as in panel A.

Figure 5. Bi-directional MSE-dependent mORC1/SMA2 expression. (A) A schematic shows the wild type and MSE mutant sequences upstream of ORC1. The deleted sequence is given in red, flanking bases are enlarged and given in bold. (B) The output of RT-PCR assays with samples from wild type cells versus cells lacking the MSE upstream of mORC1 (MSEΔORC1) is shown for the ORC1 isoforms and for ACT1. RT-PCR signals are given as bar diagrams. (C) RT-PCR data are given for SMA2 and ACT1 in wild type (WT) and motif deletion strains (MSEΔORC1) as in panel B.
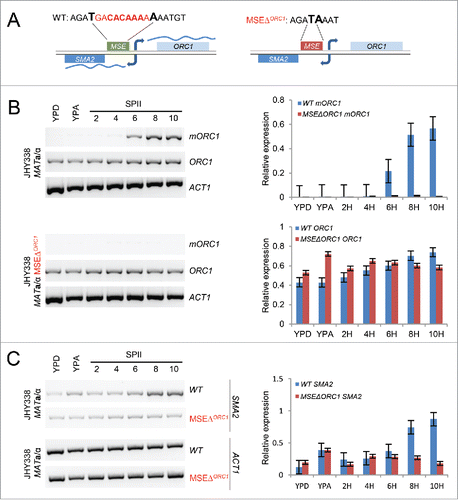
Figure 5. Bi-directional MSE-dependent mORC1/SMA2 expression. (A) A schematic shows the wild type and MSE mutant sequences upstream of ORC1. The deleted sequence is given in red, flanking bases are enlarged and given in bold. (B) The output of RT-PCR assays with samples from wild type cells versus cells lacking the MSE upstream of mORC1 (MSEΔORC1) is shown for the ORC1 isoforms and for ACT1. RT-PCR signals are given as bar diagrams. (C) RT-PCR data are given for SMA2 and ACT1 in wild type (WT) and motif deletion strains (MSEΔORC1) as in panel B.

Figure 6. Phenotypic analysis of the MSE deletion mutant. (A) A graph shows the percentage of wild type and MSE mutant cells cells (y-axis) at the bi-nuclear (MI), tetra-nuclear (MII) and ascus stage over time in sporulation medium shown in hours (x-axis). (B) Representative images of wild type (top) and MSE deletion (bottom) strains are shown using differential interference contrast (DIC, left), fluorescent staining of DNA (DAPI, middle) or both (merged, right). The strains are given to the left. A bar indicates 50μm.
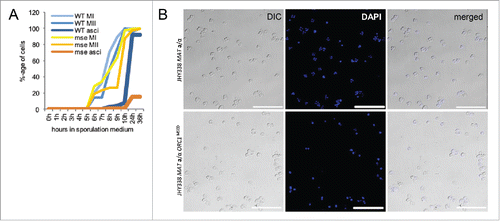
Figure 6. Phenotypic analysis of the MSE deletion mutant. (A) A graph shows the percentage of wild type and MSE mutant cells cells (y-axis) at the bi-nuclear (MI), tetra-nuclear (MII) and ascus stage over time in sporulation medium shown in hours (x-axis). (B) Representative images of wild type (top) and MSE deletion (bottom) strains are shown using differential interference contrast (DIC, left), fluorescent staining of DNA (DAPI, middle) or both (merged, right). The strains are given to the left. A bar indicates 50μm.

Figure 7. ORC1 RNA vs. Orc1 protein levels. (A) A schematic shows the ORC1 locus in blue and the extended 5′UTR in gray at the top. Genome coordinates for the ORC1 ORF and the meiotic transcription start site (TSS) are given. Two in frame upstream ORFs located in the 5′-UTR are shown in red at the bottom. The amino acid sequences are indicated and an asterisk represents the stop codon. (B) Cells from wild type (JHY388 MATa/α) and MSE mutant (JHY338 MATa/α MSEΔORC1) strains were cultured in growth media (YPD, YPA) an sporulation medium (SPII) at the time points indicated in hours. As shown to the right, protein samples were analyzed for Orc1, using Pgk1 as a loading control. RNA samples were assayed for the long isoform (mORC1), and the short isoform (ORC1), using ACT1 as a loading control. (C) A color-coded graph shows quantified log-transformed units (y-axis) representing Orc1 protein levels in panel B for samples from growing and sporulating cells (x-axis). Samples from wild type (WT) cells are shown in black, those from mutant (MSEΔORC1) cells are shown in orange.
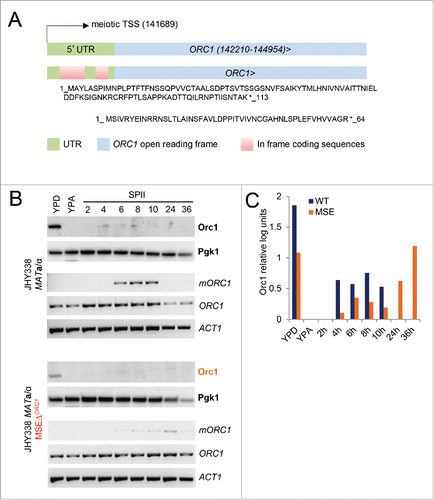
Figure 7. ORC1 RNA vs. Orc1 protein levels. (A) A schematic shows the ORC1 locus in blue and the extended 5′UTR in gray at the top. Genome coordinates for the ORC1 ORF and the meiotic transcription start site (TSS) are given. Two in frame upstream ORFs located in the 5′-UTR are shown in red at the bottom. The amino acid sequences are indicated and an asterisk represents the stop codon. (B) Cells from wild type (JHY388 MATa/α) and MSE mutant (JHY338 MATa/α MSEΔORC1) strains were cultured in growth media (YPD, YPA) an sporulation medium (SPII) at the time points indicated in hours. As shown to the right, protein samples were analyzed for Orc1, using Pgk1 as a loading control. RNA samples were assayed for the long isoform (mORC1), and the short isoform (ORC1), using ACT1 as a loading control. (C) A color-coded graph shows quantified log-transformed units (y-axis) representing Orc1 protein levels in panel B for samples from growing and sporulating cells (x-axis). Samples from wild type (WT) cells are shown in black, those from mutant (MSEΔORC1) cells are shown in orange.

Figure 8. A model for mORC1/SMA2 induction in meiosis. A schematic depicts the mitotic (top) and meiotic (bottom) regulation of ORC1 and SMA2 shown as light and dark blue rectangles, respectively, by Sum1 (dark red) and Ndt80 (green). Mitotic and meiotic ORC1 5′-UTRs are shown in green. SUT292 and XUT1538 are given in blue and red, respectively. The MSE is given as a light green rectangle. Transcripts are shown as wavy lines for which the thickness represents the expression level. Black lines represent the top and bottom DNA strands.
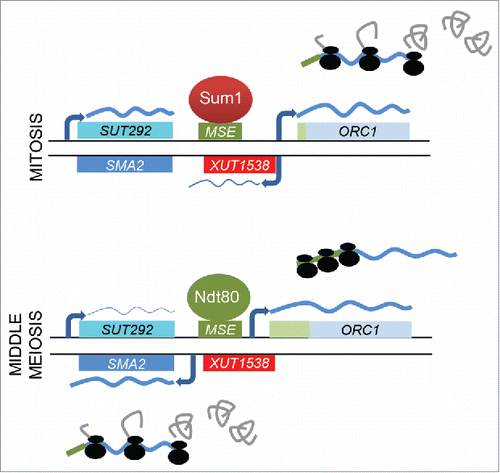
Figure 8. A model for mORC1/SMA2 induction in meiosis. A schematic depicts the mitotic (top) and meiotic (bottom) regulation of ORC1 and SMA2 shown as light and dark blue rectangles, respectively, by Sum1 (dark red) and Ndt80 (green). Mitotic and meiotic ORC1 5′-UTRs are shown in green. SUT292 and XUT1538 are given in blue and red, respectively. The MSE is given as a light green rectangle. Transcripts are shown as wavy lines for which the thickness represents the expression level. Black lines represent the top and bottom DNA strands.

Table 1. Yeast strains.

Table 2. Oligonucleotides for RT-PCR assay.

Table 3. Oligonucleotides to construct and validate MSE deletion.

Supplemental material

Supplemental_Data.zip

Download Zip (1.4 MB)

Reprints and Corporate Permissions

Please note: Selecting permissions does not provide access to the full text of the article, please see our help page How do I view content?

To request a reprint or corporate permissions for this article, please click on the relevant link below:

Academic Permissions

Please note: Selecting permissions does not provide access to the full text of the article, please see our help page How do I view content?

Obtain permissions instantly via Rightslink by clicking on the button below:

If you are unable to obtain permissions via Rightslink, please complete and submit this Permissions form. For more information, please visit our Permissions help page.