Figures & data
Figure 1. The mRNA profile of U87 EVs and cells are significantly different. mRNA was isolated from U87 exosomes (Exo), large oncosomes (LO), and U87 cells, and was profiled by RNA-Seq. (A) The purity of LO and Exo fractions was confirmed via Western blotting for HSPA5, GAPDH, and CD81. (B) The electropherograms show the time distribution and fluorescence intensity (FU) of total RNA in LO, Exo, and cells. (C) RNA yields from U87 LO were substantially higher than RNA yields from U87 Exo. (D) The mRNA profiles of the Exo and LO EV fractions correlate very well (r = 0.94). (E-F) The mRNA profiles of both Exo and LO exhibited significant differences with the mRNA profile of U87 donor cells (r = 0.74, and 0.73 respectively). (G) The mRNA in U87 LO is less unspliced (more spliced) than the mRNA in U87 cells. The fraction of unspliced RNA-Seq reads was calculated for each gene in U87 LO and U87 cell data sets, in comparison with ENCODE RNA-Seq database on whole cell, cytosol, and nucleus from various cancer cell lines. * - p < 0.001. (H) U87 LO and Exo fractions are enriched for short mRNA transcripts in comparison with U87 cells. The annotated transcript length was found for mRNAs enriched or depleted in U87 EVs vs. cells, and in ENCODE cytosol vs. whole-cells.
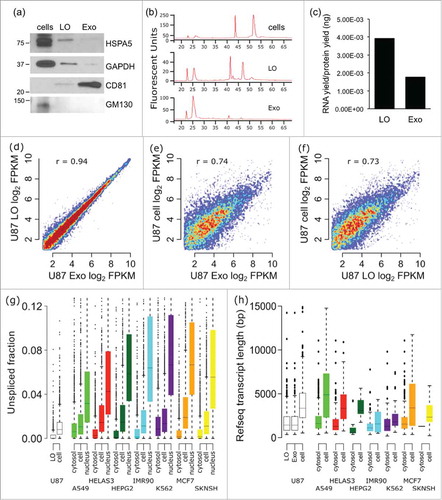
Figure 2. U87 EVs are derived from U87 cytosol and enriched for S-phase associated transcripts. (A) U87 EVs are depleted for mRNAs encoding a signal peptide, and enriched for E2F4 targets and histone mRNAs. The only phase of the cell cycle in which both E2F targets and histone mRNAs are upregulated simultaneously is the S-phase, which suggests that mRNA export in LO occurs in S-phase. The fold-changes of genes in the 3 gene sets were found between U87 EVs and cells. Density is displayed as the estimated density of genes in each gene set in 1024 ranked bins. (B) Expression microarray data comparing mRNA in EVs and cells from the indicated cell lines recapitulate the signal peptide (cyan) and the E2F4 target (light purple) patterns observed in the U87 EVs and cells. A depletion of signal peptide bearing mRNAs and an enrichment of E2F4 targets were observed in EVs from U87, SW480, and MDA-MB-231. * - p < 0.001. (C) U87 cells stably expressing DHB-YFP (green) were used for immunofluorescence imaging. Non-apoptotic blebbing, which results in LO formation, is associated with translocation of DHB-YPF from the nucleus to the cytoplasm, indicating that the cells are in the S-phase of the cell cycle when LO formation occurs. A representative confocal image is shown. Nuclei were stained with DAPI (blue). Arrows indicate the LO.
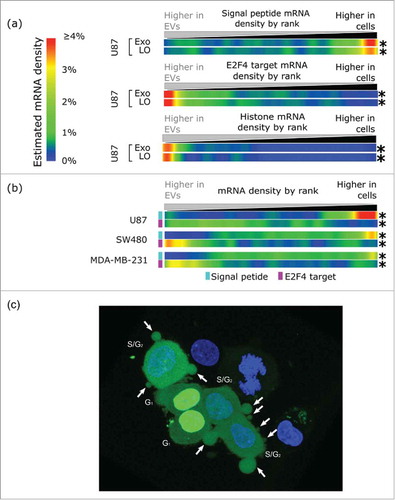
Figure 3. VEGFA appears as one component of biological pathways enriched in LO. (A) Scatter plot showing the log2 abundance in the LO set and the log2 ratio between LO and Exo for transcripts with an absolute log2 fold-change of at least 1 between the LO and Exo mRNA sets. Genes validated by qRT-PCR are highlighted, with genes found to be of higher abundance in LO labeled in red, and genes found to be of lower abundance in LO labeled in blue. (B) Validation of mRNA abundance differences between LO and Exo mRNA fractions. For 11 genes, the RNA-Seq fold-change ranking was validated via Fluidigm qRT-PCR, with a strong correlation between the 2 methods (r = 0.76). Gene ontology (GO) enrichment analysis using FunRich software indicates the cellular component (5 out of 6 GO terms show association with membrane structures) (C), molecular function (D) and biological pathways (E) for the mRNAs overrepresented in LO. 2 out of 3 and 3 out of 5 GO terms respectively associated with transporter or receptor functions. For each GO category the plots show, on the x-axis, the percentage of genes that belong to the GO term indicated in the y-axis. Only statistically significant enrichment is displayed (Bonferroni corrected; * for p < 0.05, ** for p < 0.001), and the numbers below the asterisks indicate the number of genes for each GO term. FC = fold change; (F) VEGFR mRNA levels were measured by qRT-PCR in HUVEC cells at baseline or after treatment with LO at the indicated time points (* p < 0.05).
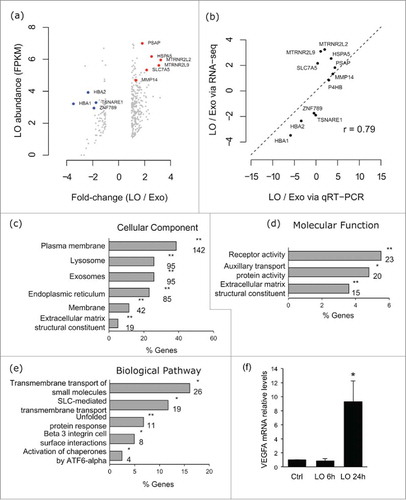
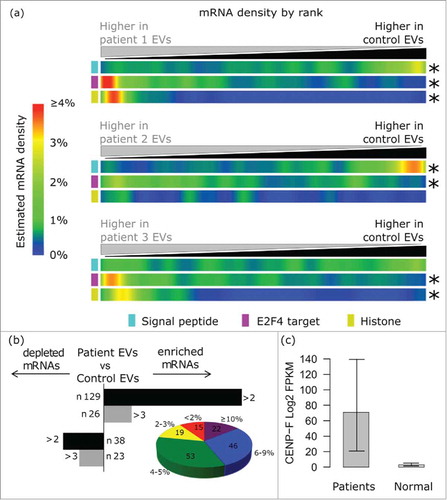
Figure 4. Analysis of 15 plasma whole transcriptomes identifies a global EV mRNA signature and breast cancer signal in patients. (A) The EV signature (depletion of signal peptide encoding mRNAs, enrichment of E2F4 targets and enrichment of histones) was recapitulated in vivo in EVs isolated from 2 out of 3 patients with invasive lobular carcinoma (ILC) vs. control individuals. (B) The histogram on the left shows the number of transcripts that are enriched or depleted of at least 2-fold (Log 2) in EVs from all breast cancer patients in comparison with controls. The pie chart shows the distribution of the mRNAs that we found upregulated in plasma EVs in TCGA breast cancer tissues. The size of each slice is determined by the number of transcripts that are enriched in given fractions of patients. 15 mRNAs were altered in 0–1% of the cases, 19 in 2–3% of the cases, 53 in 4–5% of the cases, 46 in 6–9% of the cases, 22 in > 10% of the cases. (C) CENPF Log 2 expression (FPKM) in plasma EVs from patients (n = 15) vs. healthy controls (n = 5).