Figures & data
Figure 1. Transcriptome-wide identification of HuR-associated circRNAs. (A,B) Schematic of the strategy used to identify globally HuR-interacting circRNAs in HeLa cells (A). Following cell lysis, RIP analysis was carried out using anti-HuR or control IgG antibodies; the presence of HuR in the IP samples was assessed by Western blot analysis [(B); HC, heavy IgG chain]. Total RNA was isolated and digested with RNase R, and circRNAs present in the sample were identified using circRNA microarrays (Arraystar). (C) Partial list of circRNAs highly enriched in HuR IP relative to IgG IP as identified in microarrays (n = 3).
![Figure 1. Transcriptome-wide identification of HuR-associated circRNAs. (A,B) Schematic of the strategy used to identify globally HuR-interacting circRNAs in HeLa cells (A). Following cell lysis, RIP analysis was carried out using anti-HuR or control IgG antibodies; the presence of HuR in the IP samples was assessed by Western blot analysis [(B); HC, heavy IgG chain]. Total RNA was isolated and digested with RNase R, and circRNAs present in the sample were identified using circRNA microarrays (Arraystar). (C) Partial list of circRNAs highly enriched in HuR IP relative to IgG IP as identified in microarrays (n = 3).](/cms/asset/12f90052-521a-4ce4-b3e7-d6f96a6458b3/krnb_a_1279788_f0001_b.jpg)
Figure 2. Validation of HuR target circRNAs. (A) RT-qPCR analysis of HeLa circRNAs enriched in HuR IP samples compared with IgG samples; RNA levels were normalized to the background levels of GAPDH mRNA in each IP sample. (B) Example of PCR product validation; hsa_circ_0031288(CircPABPN1) was visualized on ethidium bromide-stained agarose gels to confirm the specificity of the circRNA amplification band (RT, reverse transcription). (C) Validation of circRNA PCR product from (B) by DNA sequencing analysis. All of the circRNAs in (A) were verified on agarose gels and many were further verified by sequencing. (D) RT-qPCR analysis to measure GAPDH mRNA, PABPN1 mRNA, and hsa_circ_0031288 (CircPABPN1) with or without RNase R treatment; RNA levels in RNase R-treated samples were compared with mock (untreated) samples (using identical input RNA amounts). (E) Western blot analysis of HuR levels in the samples pulled down using control biotinylated GAPDH (3′UTR) and linear biotinylated CircPABPN1. ‘Input’, HuR levels in the samples used for pulldown analysis. (F) Western blot analysis of HuR levels in pulldown assays using a biotinylated antisense oligomer targeting the junction of CircPABPN1 or a control biotinylated oligomer. Data in (A,D) are the means and ± SEM from three independent experiments. Data in (B,E,F) are representative of three independent experiments.
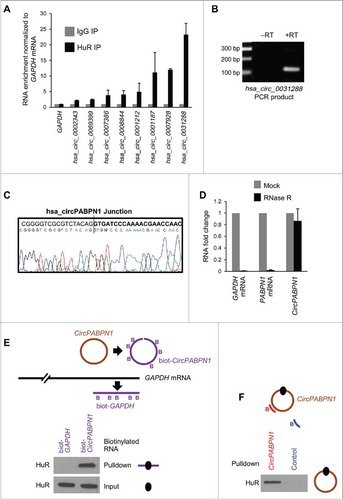
Figure 3. Transcriptome-wide identification and validation of HuR target circRNAs. (A) Schematic representation of the strategy used to identify globally HuR-interacting circRNAs using publicly available CLIP data sets (Methods). (B) Among the annotated circRNAs (CircBase, Aug 4 2015), ∼56% potentially contained HuR target sites, 44% did not, and for <1% HuR binding sites were at the junction. Among the putative target, most HuR binding sites were found within the body, and a few spanned the junction. (C, D) Partial validation of HuR target circRNAs found in panel (B) by RIP (HuR IP relative to IgG IP) followed by RT-qPCR analysis; circRNAs with HuR sites in the body (C) and the junction (D) were studied. (E-G) HeLa cells were transfected with either pcDNA3 or with pCircPABPN1; 48 h later, the levels of CircPABPN1 were assessed by RT-qPCR analysis (normalized to GAPDH mRNA) (E), the levels of HuR by Western blot analysis (loading control HSP90) (F), and the interaction of HuR with target mRNAs by RIP followed by RT-qPCR analysis (normalized to GAPDH mRNA) (G). Data in (C-E,G) represent the means ± SEM from three independent experiments; data in (F) are representative of three repeats.
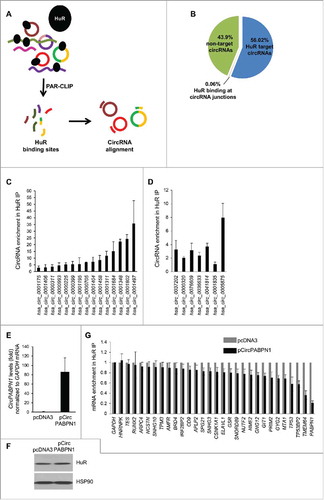
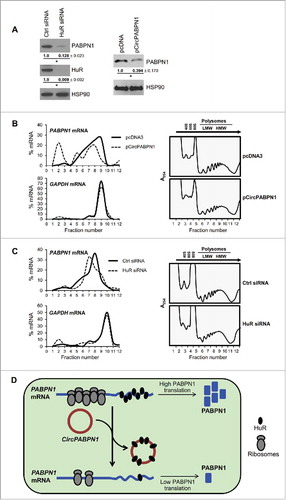
Figure 4. CircPABPN1 suppresses PABPN1 translation. (A) 48 h after transfecting HeLa cells with either control siRNA or HuR siRNA (left) or with pcDNA3 or pCircPABPN1 (right), the levels of PABPN1, HuR, and the loading control HSP90 were assessed by Western blot analysis. Following quantification of the bands on Western blots, the relative signal intensities were represented as the means ± SEM from three independent experiments. *, P <0.05 (Student's t-test)., (B, C) HeLa cells prepared as in (A) were size-separated through sucrose gradients into 12 fractions (arrow, direction of sedimentation). Unbound RNA was in fractions 1 and 2; 40S, 60S, and 80S were in fractions 3–5; and low- and high-molecular-weight polysomes (LMWP and HMWP) were in fractions 6–8 and 9–12, respectively (B right, C right) and Methods. After isolating RNA from each fraction, the relative distribution (%) of PABPN1 and GAPDH mRNAs on the sucrose gradients was quantified by RT-qPCR analysis (B left, C left). (D) Proposed model whereby CircPABPN1 sequesters HuR away from PABPN1 mRNA, in turn suppressing PABPN1 mRNA translation.