Figures & data
Figure 1. Workflow to determine modification levels in tRNA during yeast growth cycle. The isolated total RNA was purified by size exclusion chromatography (SEC) (*5.8S/5S rRNA peak, #unknown contamination). The tRNA fraction was then digested and the obtained nucleosides separated and quantified over LC-MS to receive the shown chromatogram on the upper right side. The average amounts of the respective modifications per molecule tRNA in log growing cells were calculated and plotted (error bars represent SD of n = 3). The quantification was repeated during growth (arrows indicate sample time points) and the quantities of the modifications Cm and m7G were plotted over time. Abbreviations: D = dihydrouridine, Ψ = pseudouridine, C = cytidine, m1A = 1-methyladenosine, U = uridine, m5C = 5-methylcytidine, m7G = 7-methylguanosine, Cm = 2′-O-methylcytidine, I = Inosine, G = guanosine, m5U = 5-methyluridine, m1G = 1-methylguanosine, Gm = 2′-O-methylguanosine, m2G = N2-methylguanosine, A = adenosine, m22G = N2,N2-dimethylguanosine, Am = 2′-O-methyladenosine.
Figure 2. Mass spectra of guanosine (G) and 7-methylguanosine (m7G) in different growth media. a unlabeled medium: [M+H]+ (G) 284, [M+H]+ (m7G) 298. b D3-methionine containing medium: [M+H]+ (G) 284, [M+H]+ (m7G) 301. c 15N2 uracil and 13C6 glucose containing medium: [M+H]+ (G) 290, [M+H]+ (m7G) 304. d 15N2 uracil, 13C6 glucose and D3 methionine: [M+H]+ (G) 290, [M+H]+ (m7G) 307. e SILIS: [M+H]+ (G) 294, [M+H]+ (m7G) 311.
![Figure 2. Mass spectra of guanosine (G) and 7-methylguanosine (m7G) in different growth media. a unlabeled medium: [M+H]+ (G) 284, [M+H]+ (m7G) 298. b D3-methionine containing medium: [M+H]+ (G) 284, [M+H]+ (m7G) 301. c 15N2 uracil and 13C6 glucose containing medium: [M+H]+ (G) 290, [M+H]+ (m7G) 304. d 15N2 uracil, 13C6 glucose and D3 methionine: [M+H]+ (G) 290, [M+H]+ (m7G) 307. e SILIS: [M+H]+ (G) 294, [M+H]+ (m7G) 311.](/cms/asset/d69d2b95-bd67-41cb-b955-e9412f6fa82b/krnb_a_1325063_f0002_oc.jpg)
Table 1. Mass transition and mass increase compared with non-labeled canonical nucleosides from “heavy” minimal medium with 15N2-uracil and 13C6 glucose label.
Figure 3. Principle of the developed NAIL-MS assay and RNA species emerging over time. a Yeast is grown in heavy isotope medium which results in heavy labeled nucleosides. The experiment is initiated by medium exchange with D3-methionine labeled medium. New canonicals are unlabeled while pre-existing nucleosides remain 15N/13C labeled. b Original tRNA quantities stay constant over time (red), while new tRNAs are synthesized (black line) as cells grow (OD 600 gray line) (error bars are SD of n = 3). c Different modified nucleosides can be distinguished according to their labeling. New modified nucleosides have an unlabeled canonical building block and a D3-methyl mark, original modified nucleosides derive from labeled canonicals but carry the unlabeled methylation and original, labeled canonicals which receive a methyl mark after experiment initiation have an additional D3-methyl group. d Mass spectrum of potential isotopomers of 7-methylguanosine (m7G) in a NAIL-MS experiment: *unlabeled m7G as a reference (298), from new tRNA (301), from original tRNA with pre-existing methylation (304), from original tRNA but from post-methylation (307) and the signal of the m7G SILIS (311).
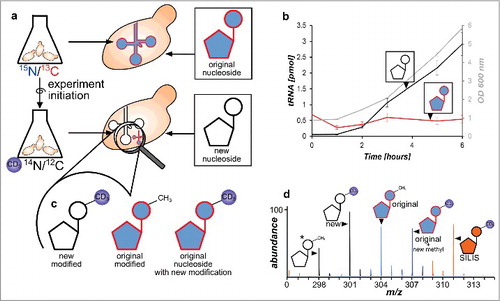
Figure 4. Levels of modifications in tRNA during a time range of 24 h discriminated by the original and newly-synthesized tRNA pool. *The quantity of modification was normalized to its respective origin (e.g., new m7G was normalized to abundance of new tRNA to receive the number of m7G per new tRNA while original m7G was normalized to original tRNA). a Level of 7-methylguanosine (m7G) in new and original tRNAs over time. The constant level of original m7G is caused by a constant increase in pre-existing m7G, while post-methylated m7G increases (box). (error bars reflect the SE of n = 6) b 2′-O-methylcytidine (Cm) increases fast in newly synthesized tRNAs, while the level of pre-existing Cm drops (box). This drop is masked by substantial post-methylation of original tRNAs. (error bars reflect the SE of n = 6) c Pseudouridine quantities are lower in newly-synthesized tRNAs while d the number of inosine per respective tRNA is constant throughout the experiment (both n = 3)
Figure 5. Extent of post-methylation in the original tRNA pool in %. Most modified nucleosides (Am, Gm, m1G, m2G, m22G, m1A and m5C) plateau at 10% which indicates that 10% of all modifications in the original tRNAs were made after experiment initiation (delayed methylation). Cm (graph on the left) is an exception. Here up to 18% of all Cm in original tRNA are incorporated after experiment initiation. (in all graphs the error bars reflect the SE of n = 3)