
Figures & data
Figure 1. Model of mRNA structure controlling protein compactness. A: ribosome spends more time to unwind structured mRNA, leaving time for the nascent peptide to co-translationally fold into a compact conformation. B: Protein or domain linkers are encoded by either unstable mRNA or stable mRNA. In the latter case, stable structural elements in mRNA can slow down translation, leaving time for the linker to be targeted for post-translational modifications.
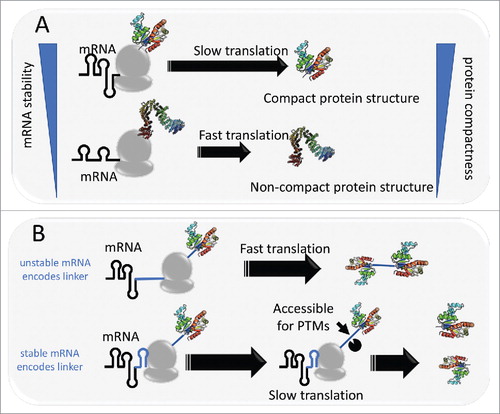
Figure 2. Schematic representation of the mRNA stability landscape depending on GC content and selective pressure. The GC content defines the mRNA stability range for each species. Double arrows depict correlations between mRNA folding energy and dS for S. cerevisiae (orange), E. coli (violet) and D. radiodurans (green) transcripts. Large blue arrows show selection pressure on mRNA stability.
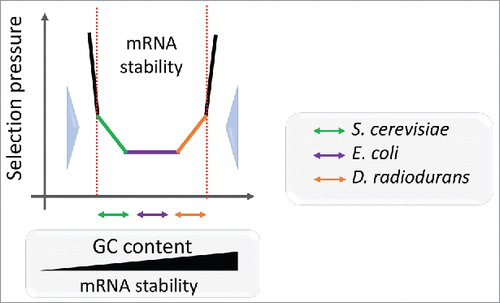
Figure 3. Correlation between energy profile distance (ΔΔG) between orthologous mRNAs and evolutionary rates (estimated using PAML47) as synonymous and non-synonymous sites (dS and dN, respectively, shown on the logarithmic scale). The plots include 2,638 pairs of orthologs from E. coli and S. typhi, and 6,783 pairs of orthologs from H. sapiens and M. musculus. The sets of orthologous genes are from .29 Spearman rank correlation coefficients (SPR) between profile energy distance and evolulationary rates (dS in blue, dN in red) are significant (p < 0.005) as indicated in the corner. Slopes of the linear regression (S) are indicated next to the trend line.
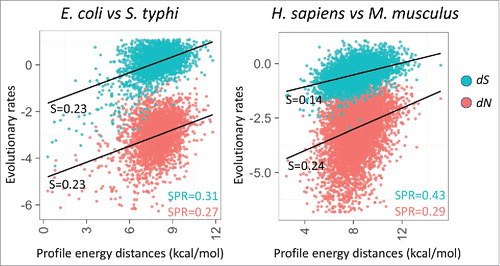
Table 1. Statistical analysis of the connections between mRNA energy profile distance (ΔΔG) and evolutionary rates (dS and dN).