Figures & data
Figure 1. RIP-seq strategy and data analysis. (A) Schematic representation of the domain structure of p68 protein. (B) Outline of RIP-seq analysis pipeline. (C) RIP in HEK293T cells using p68 antibody (top panel). Specificity of the pull down was ascertained by enrichment of SRA RNA in p68 IP (bottom panel). Input represents 10% of the total sample. (D) Scatter plot showing the pattern of enriched transcripts. Read counts (log 2) for each transcript are plotted against that of control (Control+2 and IP+2 to avoid division by zero). Reads with read coverage >10 are plotted. (E) Different types of transcripts obtained in the RIP. SE – single exonic lncRNA transcripts and ME – Multi exonic lncRNA transcripts.
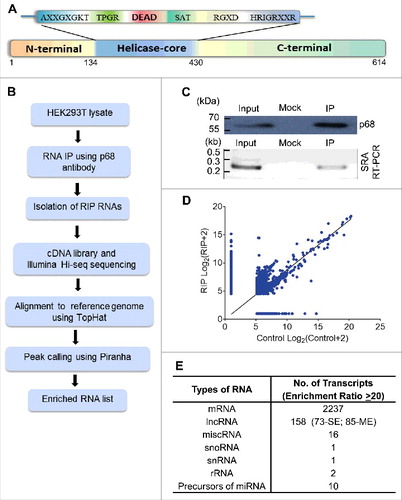
Figure 2. p68 interacting single exonic lncRNAs. (A) We filtered 54 single exonic lncRNA transcripts from 72 single exonic lncRNA transcripts of RIP-seq, transcripts with more than 80% of similarity with its genomic region has been selected and plotted based on their Log2 fold enrichment ratio and few transcripts were selected (red) for further validation by RIP-PCR in HEK293T cells. (B) RIP-PCR of selected transcripts in p68, SF2 (negative control) and RPL7 (negative control) antibody pulldown complexes.
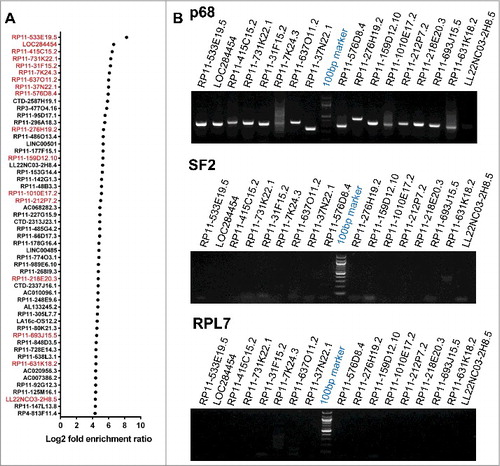
Figure 3. LOC284454 RNA is a stable RNA that interacts with p68 in vivo. (A) LOC284454 is located on human chromosome 19 (chr19:13945330-13947473). Genomic sequence analysis showed that the RNA is 2 nucleotide downstream to the 3′ end of miR-23a∼27a∼24-2 cluster. The transcription start site and the validated promoter region are marked. (B) Schematic representation of LOC284454 primary transcript. The Drosha cleavage site which generates the miRNA cluster and the LOC284454 is marked. The blue arrow depicts the primer annealing positions on the primary transcript and black arrows on the LOC284454 specific region. (C) Drosha silencing was carried out with pool of 2 independent siRNAs. A representative western blot using anti Drosha antibody shows reduced Drosha level at 72 h post transfection. (D) The 2.2 kb full length PCR product was detected from genomic DNA (lane 2) and Drosha silenced cDNA (lane 4) but not from Drosha scrambled siRNA cDNA template (lane 3). The 1.77 kb LOC284454 was detected from both Drosha control cDNA (lane 6) and Drosha silenced cDNA (lane 7). Genomic DNA was used in lane 2 and lane 5 as positive control for PCR. (E) In vivo pull-down of LOC284454 in HEK293T cells transfected with plasmid containing LOC284454 fused with S1 aptamer at the 3' end. Presence of p68 was observed in the LOC284454-S1 aptamer pull-down but not in the mock pull-down. (F) RNA immunoprecipitation with p68 antibody shows the presence of p68 (top) and enrichment of LOC284454 in the IP fraction (bottom). (G) LOC284454 RNA enrichment in IP fractions of anti-p68 antibody, anti-SF2 antibody, anti-RPL7 antibody and Rabbit anti-IgG, *** – p≤0.0001 and NS-non-significant paired two tailed t test (H) RIP-PCR from p68 IP fraction for primary transcript (2.2kb), LOC284454 (1.7kb) and miRNA cluster, SRA lncRNA was used as a positive control for p68 specificity. (I) RNA stability assay of LOC284454 RNA and 18S rRNA in the presence of actinomycin D (10µg/ml). These data show the means ± SD from three independent experiments in triplicate.
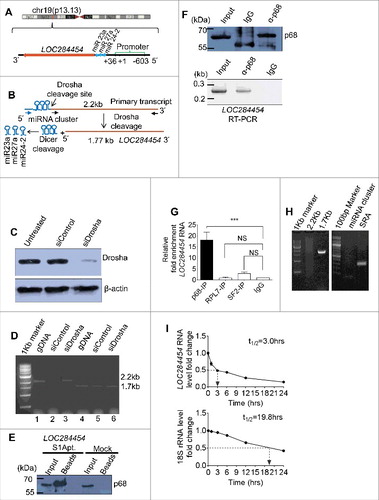
Figure 4. LOC284454 is a non-coding RNA expressed across all the tissues. (A) Coding potential score distribution from CPAT between coding (white bar) and noncoding (black bar) transcripts for LOC284454, SRA1, GAS5, GAPDH and β-actin transcripts. (B) Combinatorial effects of Fickett score, and ORF size on GAPDH and β-actin as coding genes (black dots) and LOC284454, SRA1 and GAS5 as noncoding genes (white dots). (C) In vitro transcription-coupled translation experiment in the presence of 35S methionine with pcDNA –LOC284454 construct failed to detect any protein product. Lane 1 positive control pcDNA–GFP gave a protein product around 27- kDa. In lane 3 empty vector served as a negative control. Bottom panel- RT-PCR of RNA isolated from the in vitro transcription-coupled translation assay of pcDNA-LOC284454 in the presence and absence of RT. (D) Northern blot analysis for LOC284454 with 32P- labeled full length RNA probe showing the presence of LOC284454 in HEK293T cells. (E) Tissue specific expression of LOC284454 analysed by qPCR from cDNA derived from normal human tissues. Gene expression levels were normalized to β-actin.
Figure 5. LOC284454 RNA is localized to nucleus and present predominately in the chromatin fraction of HEK293T cells. (A) and (B). HEK293T cells were fractionated into nuclear (NF) and cytoplasmic (CF) fractions. U1 snRNA (A) and GAPDH protein (B) were used to assess the purity of the fractions. (C) Presence of LOC284454 RNA in the nuclear fraction was assessed by RT-PCR. (D) RNA-FISH using LOC284454 specific LNA probes labelled with 5′TYE 563 depicts (upper row) punctate nuclear localization of the RNA in HEK293T cells. LOC284454 RNA was localized in the nucleus even in overexpressed condition (middle row). Cells treated with RNAse A prior to hybridization shows no signal (lower row). Nucleus is stained with DAPI. The scale bar is 10 μm. (E) Sub-cellular fractionation of HEK293T cells. Tubulin, histone H3 and laminin proteins were used to assess the purity of the cytoplasmic (CP), chromatin (Ch) and nucleoplasmic (NP) fractions respectively. (F) LOC284454 is present both in nucleoplasm and chromatin fractions. (G) Immuno pull-down experiment with H3 antibody. The H3 pull-down fraction was probed with p68 antibody which also showed the presence of p68 on chromatin. (H) qPCR analysis shows the enrichment of LOC284454 in the H3 pull-down fraction. The data are expressed as the mean ± S.E.M from three replicates *-p≤0.05, **-p≤0.001, ***-p≤0.0001, NS-Non-significant, paired two tailed t test. SRA and MALAT1 were used as positive control and U1 snRNA was used as the negative control. i. Presence of LOC284454 RNA and p68 on chromatin by ChOP-PCR. qPCR shows the enrichment of LOC284454 RNA in the ChOP fraction. GAPDH was used as a negative control. The data are expressed as the mean ± S. E.M from three replicates. **- p-value ≤0.01, two-tailed paired t-test. (J) p68 protein as determined by western blotting in the ChOP fraction but not in the scrambled pull-down. Input represents 10% of the total sample.
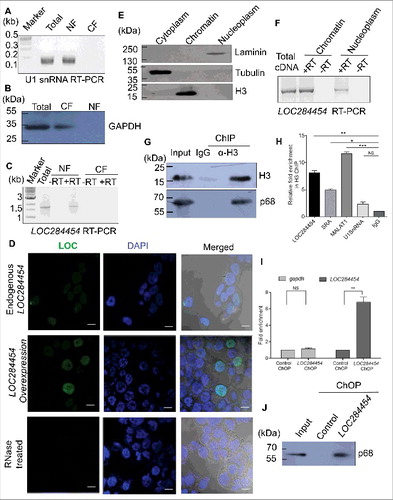
Figure 6. LOC284454 RNA is conserved only in primates Percentage of LOC24454 and miRNA-23a∼27a∼24-2 cluster conserved across selected species.
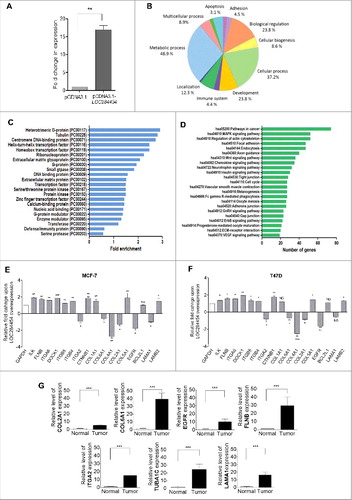
Figure 7. LOC284454 RNA expression is modulated in different cancer tissues and down-regulation of LOC284454 alters expression of selective gene sets. (A) Expression of LOC284454 RNA in different cancer tissues by qPCR. The relative difference between the expression level in tumour sample compared to normal samples are represented. **- p-value ≤0.01; ***- p-value ≤0.001 calculated by unpaired two-tailed t test. (B) Expression of LOC284454 in different breast cancer cell lines by qPCR. The data are expressed as the mean ± S.E.M from three replicates. **- p-value ≤0.01, two-tailed paired t-test. (C) Expression of LOC284454 in different breast tumor and normal tissues cDNA samples and normalized with TBP by qPCR. ****-p<0.0001, unpaired two tailed t test. (D) siRNA mediated knockdown of LOC284454 lncRNA in HEK293T cells. LOC284454 lncRNA expression was normalized with β-actin by qPCR. The data are expressed as the mean ± S.E.M from three replicates. ***-p<0.0001, paired two tailed t test. (E) Silencing LOC284454 lncRNA does not alter miRNA 23a, miR27a and miR24-2 expression. All miRNA expressions were normalized with U6 snRNA, NS refers to non-significant. (F) Gene ontology analysis by PANTHER showing the different biological processes perturbed upon LOC284454 loss of function.
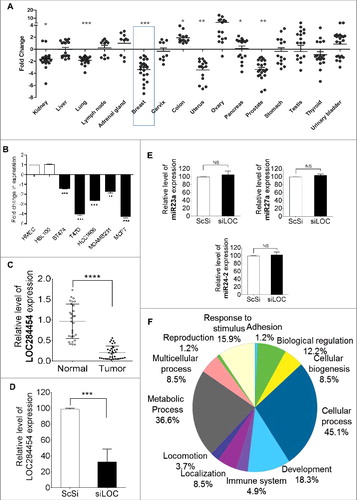
Figure 8. Effect of LOC284454 overexpression on proliferation and cell migration of breast cancer cells. (A) and (B). Cell proliferation assays depicting the change in proliferation of MCF7 and T47D cells. Proliferation was measured in terms of OD at 570nm. LOC284454 overexpressed cells showed reduced proliferation 72h post transfection. The data are expressed as the mean ± S.D from three replicates. *- p-value ≤0.05; **- p-value ≤0.01. (C) and (D). Wound healing assays were carried out in the presence of Mitomycin C in LOC284454 overexpressed MCF7 and T47D cells. After 24h of post transfection, cells were exposed to 10µg/ml of MMC and cell monolayer was scratched with a sterile pipette tip. Phase-contrast microscopic images were taken at the indicated time points. The difference in migration upon LOC284454 overexpression in MCF7 and T47D cells are calculated. The data are expressed as the mean ± S.D from three replicates. *-p<0.05, ***-p<0.0001, paired two tailed t test.
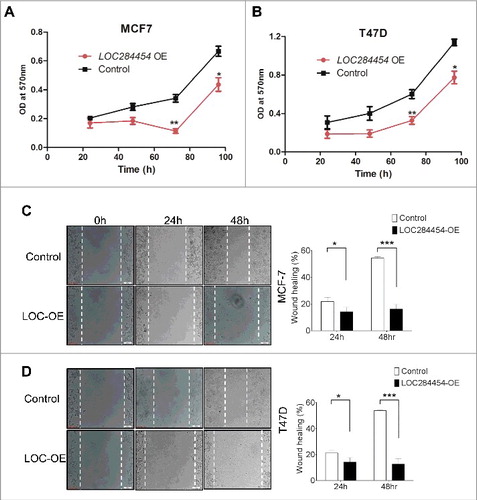
Figure 9. Overexpression of LOC284454 alters global gene expression. (A) Extent of overexpression of LOC284454 transcript in HEK293T cells. Transfection with overexpression construct results significant increase in LOC284454 transcript compared to empty vector containing cells. **- p-value ≤0.01; paired two-tailed t test. (B) Gene ontology analysis by PANTHER showing the different biological processes perturbed upon LOC284454 overexpression. (C) Over-representation of particular classes of protein as tested by PANTHER analysis. The Binomial test using Bonferroni correction was used to determine the statistical overrepresentation in the PANTHER protein class. The over-representation was calculated as genes in an input list relative to the genes in the inference list. (D) KEGG Pathway enrichment analysis of the genes using DAVID. (E and F) qPCR validation of selected genes related to focal adhesion pathway in MCF7 and T47D cells after LOC284454 overexpression. The data are expressed as the mean ± S.E.M from three replicates. Paired two-tailed t test, *-p<0.05, **-p<0.001, ***-p<0.0001 and NS-Non-significant (G) RT-qPCR validation of selected genes related to focal adhesion in breast cancer tumor (8 samples) and normal tissue (4 samples) cDNA samples and normalized with TBP. ***-p≤0.0001, unpaired two tailed t test.