
Figures & data
Figure 1. Expression analysis of L. infantum PABP1 during both promastigote and amastigote life stages. (A) Western blotting comparing the PABP1 expression with that of PABP2 and alpha-tubulin during distinct promastigote growth phases. The results from a single growth curve are shown with aliquots taken immediately after passaging to start a new culture (0h), at 2, 4 and 6 hour time points and daily after that. For all lanes equal loads were run under denaturing conditions and blotted with whole rabbit polyclonal sera directed against Leishmania PABP1 and PABP2 or serum against alpha tubulin (protein loading control). The results shown are representative of multiple experiments carried out not only with L. infantum, but also with L. major and L. amazonensis. The graphic representation of the cell counts from every aliquot is shown below the blot. (B) Western blotting showing the PABP1 expression in L. infantum during two consecutive curves grown in amastigote media. The 1st curve, the differentiation curve, started with stationary phase promastigotes and the second curve started with fully differentiated, stationary phase amastigotes as previously described [Citation52] and, as previously shown, the differentiation into amastigotes was confirmed through the detection of the A2 amastigote-specific marker. STA – Stationary cells. LAG – Lag phase culture. LOG – Logarithmic phase culture. For the PABP blots relevant molecular weight markers are shown on the left.
![Figure 1. Expression analysis of L. infantum PABP1 during both promastigote and amastigote life stages. (A) Western blotting comparing the PABP1 expression with that of PABP2 and alpha-tubulin during distinct promastigote growth phases. The results from a single growth curve are shown with aliquots taken immediately after passaging to start a new culture (0h), at 2, 4 and 6 hour time points and daily after that. For all lanes equal loads were run under denaturing conditions and blotted with whole rabbit polyclonal sera directed against Leishmania PABP1 and PABP2 or serum against alpha tubulin (protein loading control). The results shown are representative of multiple experiments carried out not only with L. infantum, but also with L. major and L. amazonensis. The graphic representation of the cell counts from every aliquot is shown below the blot. (B) Western blotting showing the PABP1 expression in L. infantum during two consecutive curves grown in amastigote media. The 1st curve, the differentiation curve, started with stationary phase promastigotes and the second curve started with fully differentiated, stationary phase amastigotes as previously described [Citation52] and, as previously shown, the differentiation into amastigotes was confirmed through the detection of the A2 amastigote-specific marker. STA – Stationary cells. LAG – Lag phase culture. LOG – Logarithmic phase culture. For the PABP blots relevant molecular weight markers are shown on the left.](/cms/asset/dc22d961-7d99-4f1a-b128-10bcd80223f5/krnb_a_1445958_f0001_b.gif)
Figure 2. Identification of the PABP1 phosphorylation motifs. (A) Structural domain organization of the L. infantum PABP1 homologue. The protein's RRM region consisting of the first two thirds of PABP1 (encompassing all four RRMs) plus the “Linker” segment and the “MLLE” domain are shown. Seven putative phosphorylation sites are indicated, six of which were targeted by site-directed mutagenesis (circled). Also highlighted are the three sets of amino acid triplets chosen for mutagenesis and localized between RRMs 1 and 2 (LMW), within RRM2 (YGF) or within the MLLE domain (TGM) The N-terminus and C-terminus fragments used for the pull-down assays are also indicated. (B) Expression of HA-tagged, episomally encoded, PABP1 evaluated with a monoclonal commercial anti-HA antibody. The left panel compared the expression of wild-type PABP1 (HA-PABP1) during three representative stages of the parasite growth curve. The right panel evaluates the expression, under the same conditions of the PABP1 mutant (TP-SP Mut) where all six putative phosphorylation sites were targeted by site directed mutagenesis.
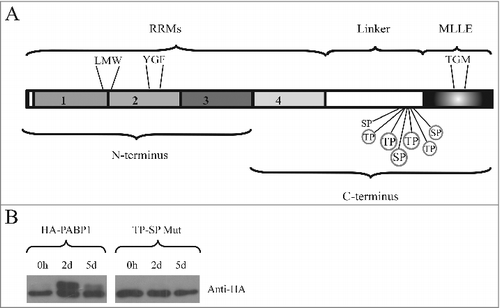
Figure 3. Polysome profile analysis of PABP1 in logarithmically growing and stationary cells. (A) Sucrose gradients (15-45%) for polysome profile analysis of L. infantum promastigotes were carried out using extracts from both logarithmic (LOG) or stationary (STA) phase stages of representative growth curves. Samples from 260 nm peaks derived from the free mRNPs, 40/60S and 80S ribosomal fractions, as well as the polysomes, were pooled and blotted with the anti-PABP1 antibodies and antibodies directed against the Leishmania ribosomal protein P0. (B) EDTA was used with the samples from logarithmic growth (LOG + EDTA) to demonstrate the dissociation of polysomes and corresponding effect on the migration of PABP1 and P0 on the sucrose gradients. The results shown are representative of a minimum of two different experiments carried out with different batches of cell growth.
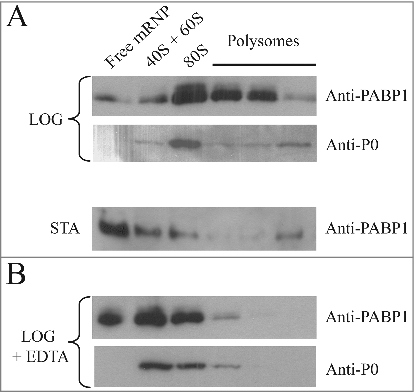
Figure 4. Identification of relevant motifs involved in PABP1 phosphorylation and polysome binding. (A) Expression analysis of HA-tagged PABP1 mutants containing selected triplets of amino acid residues replaced by alanines. The expression of the resulting proteins was evaluated in logarithmically grown cells, as shown at the 2d time point in . The effect on PABP1 phosphorylation of mutating the triplets LMW, YGF or TGM, individually, or both sets of LMW and YGF was evaluated. The results shown were reproduced using a minimum of two growth curves for each mutant and, as much as possible, the cultures were grown in parallel and assayed at the same stage of the growth, using the same number of passages following transfection. (B) Polysome profile analysis of L. infantum promastigotes expressing wild-type or mutant HA-tagged PABP1 proteins, under logarithmic growth, were carried out to investigate the association of each individual mutant to polysomes. Samples were pooled as shown in and blotted with the anti-HA antibody. For the LMW/AAA + YGF/AAA mutant, as control, the same samples were also blotted using the anti-P0 and anti-PABP1 antisera.
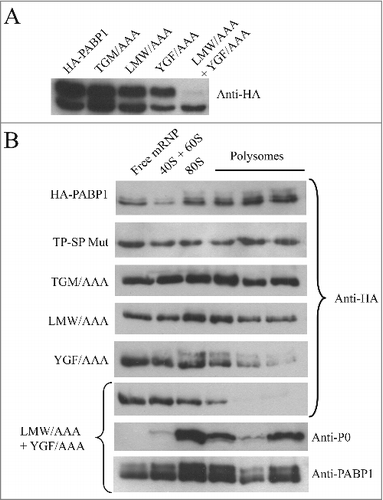
Figure 5. Generation of haploid and diploid PABP1 gene knockout mutants in L. infantum. (A) Schematic representation of the endogenous PABP1 gene as well as gene replacements following the single integration of the hygromycin (HYG) and/or puromycin (PUR) drug selectable markers. The 500 bp intergenic regions upstream and downstream of the PABP1 coding region (named 5′IR and 3′IR in the figure), and that were used to generate the knockout cell lines through homologous recombination, are indicated by the small rectangles in dark gray. The position of the primers added to the PCR reactions used to confirm the integration events are indicated by arrows, while the position of the restriction sites used for the Southern blots are also shown. (B) Agarose gel showing the PCR fragments amplified from the wild type L. infantum as well the single knockout (SKO) lineages and the double knockout (DKO) lineages generated in the presence of a plasmid encoded PABP1 gene. The oligonucleotides used for the PCR reactions are listed in Table S5. (C) Southern blots confirming the efficiency of the knockout procedures. Total genomic DNA from wild-type L. infantum as well as the SKO and DKO cells lines was digested with either ClaI or PvuII restriction enzymes and probed with the gene fragment corresponding to the PABP1 gene 5′ intergenic region (5′ IR). For (B) and (C), fragments corresponding to the wild-type PABP1 gene as well as the hygromycin (HYG KO) and puromycin (PUR KO) integration events are shown. Size markers in bp are shown on the left of the panels, while the sizes of the bands of interest are also indicated on the right. All transfection experiments were performed at least twice, generally more, with the DKOs performed using a minimum of two sets of SKO cell lines. Selected samples were used for the PCR or Southern blots.
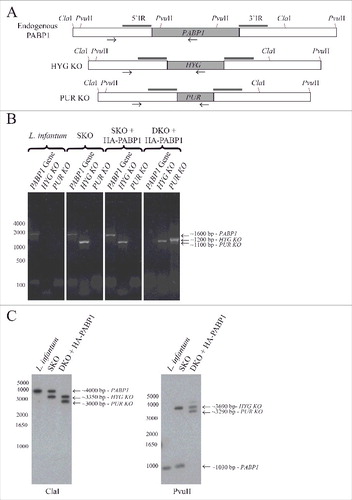
Figure 6. Evaluation of the diploid PABP1 knockout in L. infantum cell lineages complemented with various HA-tagged PABP1 mutants. (A) PCR results carried out as shown in evaluating the presence of the endogenous PABP1 gene in recombinant cell lines complemented with different PABP1 mutants. Size markers in bp are shown on the left and the sizes of the amplified bands are also indicated. (B) Western-blot using the serum directed against native PABP1 to assess expression of the non-phosphorylated and phosphorylated PABP isoforms in the cell lines complemented with the wild-type PABP1 gene (HA-PABP1) or the phosphorylation mutant (TP-SP Mut). Notice the extra phosphorylated band in the presence of the wild-type HA-tagged PABP1, which is slightly bigger in comparison with the native PABP1 (L. infantum lane) due to the presence of the HA-tag (phosphorylated and non-phosphorylated isoforms indicated by arrows). The experiments shown in (A) and (B) are representative of results generated with a minimum of two sets of independently transfected cells.
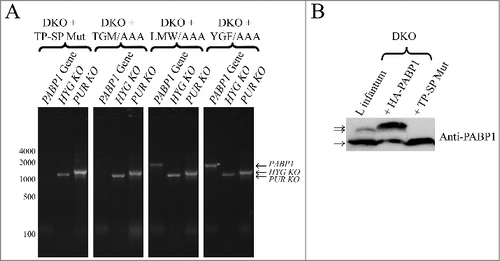
Figure 7. Cell growth phenotype of the haploid PABP1 knockout cell lineages complemented with various HA-tagged PABP1 mutants. (A) and (B) L. infantum cells lacking one of the PABP1 gene copies (SKO) were transfected with episomal vectors expressing either the wild-type HA-PABP1 or the various mutant proteins. Cells were grown as promastigotes (A) or as axenic amastigotes (B) and their growth monitored daily. Standard deviations were derived from a single experiment done with three replicates grown in parallel. Two sets of experiments were done for two sets of independently transfected cells.
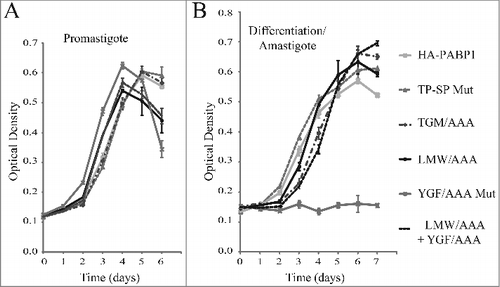
Table 1. Proteins co-purifying with HA-tagged PABP1.
Figure 8. Mapping the EIF4E4 binding region within PABP1. Co-immunoprecipitation assay to map the localization of the EIF4E4 binding motif within PABP1. (A) Recombinant L. major PABP1 expressed in Escherichia coli fusioned at its N-terminus with Glutathione S-transferase (GST), was assessed for its ability to bind to the [35S]-labeled wild-type EIF4E4. Full-length PABP1 or truncated mutants lacking part of its N- or C-terminal regions (as shown in ) were evaluated for their ability to bind to the labeled EIF4E4. (B) Full-length L. infantum GST-PABP1 was also compared with the “TGM” or the double “LMW”/”YGF” mutants as to their ability to bind to EIF4E4. The upper panels shows the Coomassie-blue stained gels indicating the recombinant GST (negative control), the wild-type GST-PABP1 fusion or the truncated proteins and mutants assayed (the recombinant proteins are indicated by arrows and the sizes of molecular weight markers are shown on the left). The panels below shows the result from the assays carried out evaluating their binding to the wild-type EIF4E4.
![Figure 8. Mapping the EIF4E4 binding region within PABP1. Co-immunoprecipitation assay to map the localization of the EIF4E4 binding motif within PABP1. (A) Recombinant L. major PABP1 expressed in Escherichia coli fusioned at its N-terminus with Glutathione S-transferase (GST), was assessed for its ability to bind to the [35S]-labeled wild-type EIF4E4. Full-length PABP1 or truncated mutants lacking part of its N- or C-terminal regions (as shown in Fig. 2A) were evaluated for their ability to bind to the labeled EIF4E4. (B) Full-length L. infantum GST-PABP1 was also compared with the “TGM” or the double “LMW”/”YGF” mutants as to their ability to bind to EIF4E4. The upper panels shows the Coomassie-blue stained gels indicating the recombinant GST (negative control), the wild-type GST-PABP1 fusion or the truncated proteins and mutants assayed (the recombinant proteins are indicated by arrows and the sizes of molecular weight markers are shown on the left). The panels below shows the result from the assays carried out evaluating their binding to the wild-type EIF4E4.](/cms/asset/422d7525-e230-4eab-b4ea-82066782dbb8/krnb_a_1445958_f0008_b.gif)
Figure 9. Evaluating the EIF4E4 PAM2 motifs and the EIF4E4/PABP1 interaction. (A) Alignment of multiple PAM2 motifs identified in various putative PABP interacting proteins isolated from different organisms with the three box (A, B and C) motifs reported for L. infantum EIF4E4 [Citation52]. Proteins from human (Homo sapiens – HS), plant (Arabidopsis thaliana – AT), fungi (Schizosaccharomyces pombe – SP) and other unicellular organisms (Dyctiostelium discoideum – DD; Plasmodium falciparum – PF) are shown, as previously described [Citation33]. The positions of the five hydrophobic residues which characterize the PAM2 motif are shown (3, 5, 7, 10 and 12). (B) and (C) Modeling of the interaction between the L. infantum EIF4E4 PAM2 motif from box B and the PABP1 MLLE domain. A segment starting at proline 484 and ending in glutamine 588 from the full-length PABP1 was used for the modeling. The alpha-helical segments of the MLLE are in blue with relevant aminoacid residues colored in yellow while the peptide backbone from the PAM2 motif is in red with selected residues colored in green. The image in (C) is horizontally rotated 180 degrees in comparison with (B).
![Figure 9. Evaluating the EIF4E4 PAM2 motifs and the EIF4E4/PABP1 interaction. (A) Alignment of multiple PAM2 motifs identified in various putative PABP interacting proteins isolated from different organisms with the three box (A, B and C) motifs reported for L. infantum EIF4E4 [Citation52]. Proteins from human (Homo sapiens – HS), plant (Arabidopsis thaliana – AT), fungi (Schizosaccharomyces pombe – SP) and other unicellular organisms (Dyctiostelium discoideum – DD; Plasmodium falciparum – PF) are shown, as previously described [Citation33]. The positions of the five hydrophobic residues which characterize the PAM2 motif are shown (3, 5, 7, 10 and 12). (B) and (C) Modeling of the interaction between the L. infantum EIF4E4 PAM2 motif from box B and the PABP1 MLLE domain. A segment starting at proline 484 and ending in glutamine 588 from the full-length PABP1 was used for the modeling. The alpha-helical segments of the MLLE are in blue with relevant aminoacid residues colored in yellow while the peptide backbone from the PAM2 motif is in red with selected residues colored in green. The image in (C) is horizontally rotated 180 degrees in comparison with (B).](/cms/asset/7a1f9c29-aea3-4845-b655-69859bba7ebd/krnb_a_1445958_f0009_oc.jpg)