Figures & data
Figure 1. Tumors mistranslate at higher rates than normal tissue. A) Normal colon samples and colon adenocarcinoma (COAD) samples from patients and xenograft tumors derived from two epithelial cancer cell lines H460 and MKN74 cell lines were analysed (n = 3). For each sample we counted the total number of mutations in the proteome, obtained using a blind search approach with the SPIDER tool in PEAKS8 software against Homo sapiens reference proteome. The misincorporation count was normalized for the total number of amino acids in the sample. The data show that these tumors have higher error rates, than the normal samples analyzed. Normal Colon Samples and COAD samples raw MS/MS data was generated by the CPTAC consortium. B) Analysis of amino acids misincorporated at protein primary structure sites (codon/amino acid family sites) showing that Stage I COAD samples had a clear error elevation at all codon family sites, relative to normal tissue, especially for Ala (A) and Asn (N). Also, on Stage IV COAD samples we observed an increase in error frequency at all protein primary sites except for Asn (N), relative to normal tissue. The total number of amino acids misincorporated at each protein site was normalized to the total number of peptides present in each sample dataset. Letters in the X axis represent the 20 amino acids and errors correspond to the total number of non-cognate amino acids misincorporated. For example N = total number of Asn sites present in the dataset that contain at least one misincorporation. Data was analyzed by two-tailed unpaired Student's t-test. Significant p-values are shown (*p < 0.05; ** p < 0.01; *** p < 0.001). Graphics depicts average +/- SEM (n = 3-5). C) Misincorporations of Serine at Alanine sites were the most frequent found in tumor xenograft samples and misincorporations of Serine at Leucine sites were among the least common. We determined the number of specific misincorporations and normalized them to the total number of peptides present in each sample data set. Graphics B and C depict average +/- SEM (n = 3).
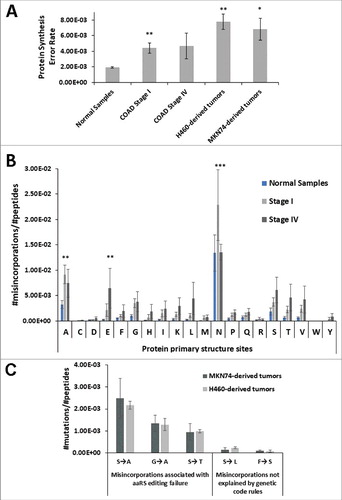
Figure 2. I n vitro phenotypic effects induced by misreading tRNAs. A) Schematic tRNA model. Left panel) The human tRNASer AGA gene (Chr6 tRNA#5), was cloned into pIRES2-DsRed plasmid and misreading constructs were generated by site-directed mutagenesis (green: Ala(AGC) and red: Leu(AAG)). Domains highlighted in grey are important for tRNASer recognition by SerRS. Right panel) Serylated misreading tRNAs misincorporate Ser at the non-cognate codons indicated. B) Expression of misreading tRNAs on stably expressing cells was confirmed using SNaPshot. Samples were sequenced and analyzed using Peak Scanner software. The endogenous copies of tRNASer were 32 and 49.5-fold more expressed than tRNASer(Ala) and tRNASer(Leu) respectively. Grey: Non-mutated Serine tRNA; Black: Misreading Serine tRNA. C) Percentage of cells in necrosis, early and late apoptosis were determined by flow cytometry using AnnexinV-FITC (1:100) and Propidium iodide (2.5µg/ml) staining. D) The number of foci arising from NIH3T3 cells was counted after 13–21 days after transfection. Data represents average ± SEM (n = 2-3) and was analyzed with Kruskal-Wallis with Dunnett's post-test using Mock cell line as control. There are no significant differences among cell lines (p > 0.05).
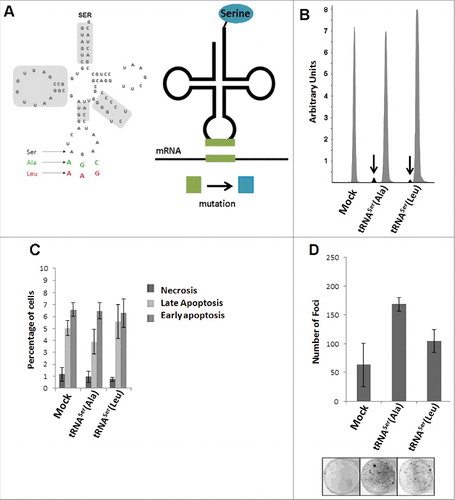
Figure 3. Pathways activated by TNFα induction. A) Treatment of cells expressing the misreading tRNAs with TNFα (30ng/ml) for 30 minutes. Upper panel) Relative activation ratios of p38 in cell lines exposed to TNFα. Middle pannel) Relative activation ratios of Akt in cell lines exposed to TNFα. Lower panel) Representative immunoblots of p38-P, total p38, Akt-P and total Akt in cell lines. β-tubulin was used as a loading control. B) Treatment of cells expressing the misreading tRNAs expressing cell lines with TNFα (30ng/ml) for 4 hours. Upper panel) Relative activation ratios of p38 in cell lines exposed to TNFα. Middle panel) Relative activation ratios of Akt in cell lines exposed to TNFα. Lower panel) Representative Immunoblots of p38-P, total p38, Akt-P and total Akt in cells lines. β-tubulin was used as a loading control. Data represents average ± SEM (n = 3) and was analyzed using Kruskal-Wallis with Dunnett's post-test and relevant p-values are displayed (*p < 0.05; **p < 0.01).
Figure 4. Impact of mistranslation on angiogenesis and tumor formation in vivo. A) CAM assay. Upper panel) Representative images of tumors and vessels produced by cell lines expressing Mock, tRNASer(Ala) and tRNASer(Leu). Lower panel, left) Quantitative evaluation of new vessels' formation. Lower panel, right) Relative tumor area. Data is presented as the percentage relative to Mock. Graphics depict average ± SEM (n = 12-14). Data was analyzed by two-tailed paired Student's t test (*p < 0.05; **p < 0.01). B) Tumorigenic capacity of misreading tRNAs in mice. Upper panel) Kinetics of tumor growth determined after inoculation of cells expressing Mock plasmid, the tRNASer(Ala), tRNASer(Leu) and K-rasV12 (positive control) constructs. Middle panel) Quantitative evaluation of tumor area at 31 days p.i.. Graphics depict the average ± SEM (n = 5-11). Data was analyzed by Kruskal-Wallis with Dunnett's post-test (**p<0.01). Lower panel) Photographs of representative tumors, H&E and Ki67 staining (40x amplification) from each condition. C) Expression of misreading tRNAs in mice tumors measured by SNaPshot. Samples were sequenced and analyzed using Peak Scanner software. Expression of the misreading tRNASer(Ala) and tRNASer(Leu) were 4 and 5.9-fold lower than the endogenous tRNASer, respectively. Grey: Non-mutated Serine tRNA; Black: Misreading Serine tRNA.
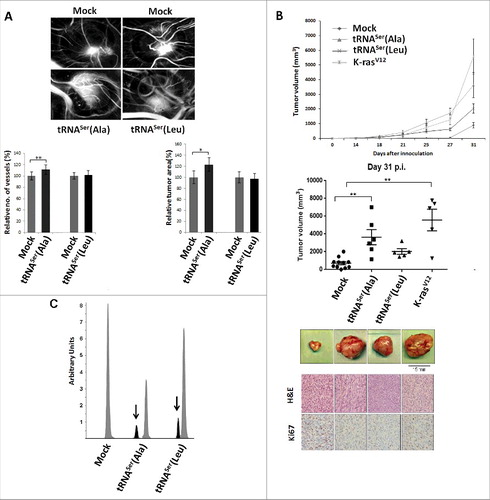
Figure 5. – Misreading tRNAs misincorporate Ser at Ala and Leu coon sites. Upper Panel) Graphic depicts the absolute number of misincorporations of Ser detected at Ala sites in the soluble fraction of proteins extracted from tumors derived from our cell lines. There was a relative increase in the incorporation of Ser at Ala sites in the cell line expressing the misreading tRNASer(Ala) at the cognate codon GCT only. tRNASer(Leu) expressing cell line was used as a negative control to show that the increase in misincorporations is induced by tRNASer(Ala). Lower Panel) Graphic depicts the absolute number of misincorporations of Ser detected at Leu sites in the soluble fraction of proteins extracted from tumors derived from our cell lines. We detected an increase of Ser to Leu misincorporations at the near-cognate codon CTC. tRNASer(Ala) expressing cell line was used as a negative control to show that the increase in misincorporations is induced by tRNASer(Leu).
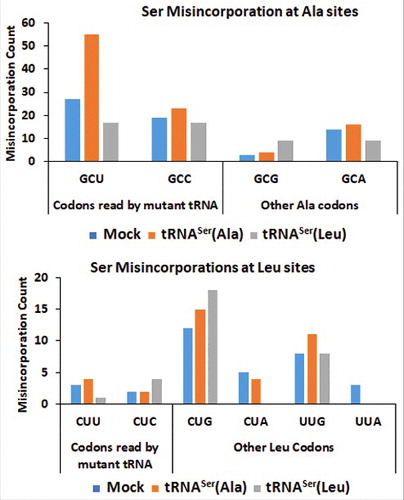
Figure 6. Activation of the UPR by misreading tRNAs in vivo. A) Activation of ATF6 in tumors harboring the wild-type and misreading tRNAs. Total ATF6 and ATF6 fragment were detected by immunoblotting. B) eIF2α-P and PP1Α catalytic subunit levels in each tumor lysate were analyzed by immunoblotting and relative expression values are shown. β-tubulin levels served as protein loading control. C) Representative immunoblots for total ATF6, ATF6 fragment, total eiF2α, eIF2α-P, PP1α catalytic subunit and β-tubulin for each membrane. Graphics depict average ± SEM (n = 3). Data was analyzed by One-way ANOVA with Dunnett's post-test and significant p-values are shown (*p < 0.05).
Figure 7. Classical cancer-associated pathways activated in mice tumors. A) Evaluation of total phosphoserine levels in tissue lysates from mice tumors. B) Relative activation ratio of Akt in tumor lysates compared to the Mock and representative immunoblots of Akt-P, total Akt and β-tubulin (loading control) from tumor lysates. Graphics depict average ± SEM (n = 3). Data was analyzed by One-way ANOVA with Dunnett's post-test and significant p-values are shown (*p < 0.05; **p < 0.01).
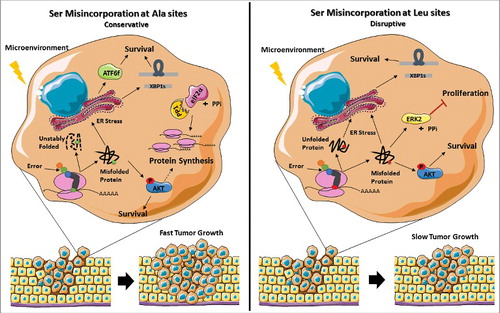
Figure 8. Representation of the stress response induced by misreading tRNAs. The mutant misreading tRNAs expressed in NIH3T3 cells exposed to microenvironment stimuli in vivo induce ER stress and activation of the Akt pathway. These events lead to UPR activation, increasing the cells capacity to thrive under stress. In tRNASer(Ala) expressing cells where eIF2α-P is downregulated by upregulation of PP1α catalytic subunit there is derepression of protein synthesis which accelerates tumor growth. On the other hand, tRNASer(Leu) show downregulation of ERK2, which has been correlated with decreased cellular proliferation, leading to slow tumor growth. Adapted from Servier Medical Art collection (http://www.servier.com).