Figures & data
Figure 1. Domain organization of human ADAR isoforms, and procedure for the RNA sequencing experiments. (a) Schematic representation of the domain structures of three expression constructs of human ADAR isoforms and their control. mGFP indicates mycGFP-tag, Zα, Z-DNA binding domain α; Zβ, Z-DNA binding domain β; dsRBD, double-stranded RNA binding domain; R, an arginine-rich single-stranded RNA binding domain. (b) Schematic representation of RNA sequencing of the ADAR-bound small RNAs and input RNAs in cells transfected with pmGFP-ADAR1-p110 or pmGFP-ADAR2.
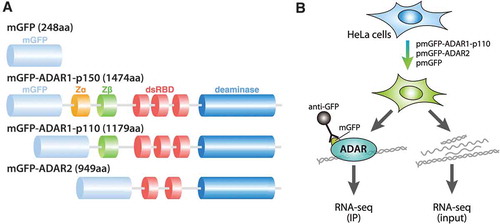
Figure 2. Length distribution of all reads mapped to annotated miRNA regions. (a) Pipeline for the quantification of miRNA abundance and its classification, and schematic representation of the secondary structure of ADAR-bound miRNAs. Distribution of miRNAs mapped to annotated miRNA regions with no mismatches (b) or with only A-to-G mismatches (c) in ADAR1-p110 input and IP, ADAR2 input and IP, and GFP input samples, respectively. Horizontal axis indicates read length. Vertical axis, fraction of reads. (d) Four classes of miRNAs mapped to annotated miRNA regions. Pri-miRNA fragment: < 90% overlap with the pre-miRNA annotation and size ≥ 25 nt. Pre-miRNA: ≥ 90% overlap with the pre-miRNA annotation and size ≥ 40 nt. MiRNA manqué: ≥ 90% overlap with the pre-miRNA annotation and size 25–39 nt (usually contains one mature miRNA sequence and part of the loop region). Mature miRNA: size ≤ 24 nt (most reads almost completely overlap with mature miRNA annotations). Enrichment of pri-miRNA fragments, pre-miRNAs, miRNA manqué, and mature miRNAs in no mismatched reads (e) and only A-to-G mismatched reads (F) in the total IP samples of ADAR1-p110 and ADAR2 compared to the corresponding input samples. Horizontal axis indicates the fraction of reads. **p-value < 0.05, ***p-value < 0.01 (Welch’s t-test).
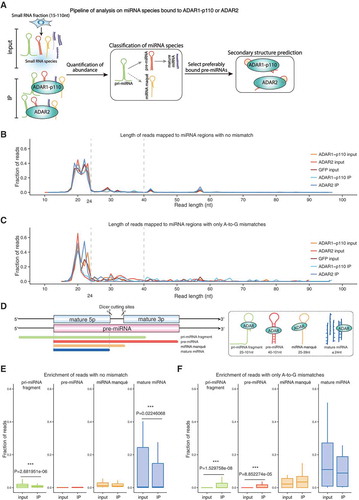
Figure 3. miRNA expression levels and binding preferences of each ADAR isoform to miRNAs. (a) Relative enrichment of pre-miRNAs (left) or mature miRNAs (right) in input samples (x-axis) and IP samples (y-axis) of ADAR1-p110 compared to those of ADAR2. The ratio of RPKM was expressed as log2-transformed values. Red dots: pre-miRNAs (left) or mature miRNAs (right) with absolute log2 ratios of RPKMs: log2 (RPKM in ADAR1-p110 IP/RPKM in ADAR2 IP) ≥ 1.0, log2 (RPKM in ADAR1-p110 input/RPKM in ADAR2 input) ≤ log2 (1.5) ≈ 0.58. Orange dots: opposite strand mature miRNA (5p or 3p) present in the same IP sample as the enriched mature miRNAs (red dots). Blue open circles: miRNA species for which an editing site was detected, regardless of miRNA maturation step (). Red arrow indicates pre-miRNA with editing site found on non-mature (hsa-mir-140) and blue arrows indicate pre-miRNAs with editing sites found on mature miRNA species (hsa-mir-7d and hsa-mir-181d-2). The remaining pre-miRNAs (left) or mature miRNAs (right) were shown as gray dots. Dashed lines of light gray color show the log2 ratio thresholds described above. Venn diagrams showing the numbers of pre-miRNA (b) and mature miRNAs (c) bound by ADAR1-p110 or ADAR2 isoform. (d) The pre-miRNAs (left) and mature miRNAs (right) corresponding to the red dots in (a) and ordered according to their log2 ratio. Pre-miRNAs (left) and mature miRNAs (right) enriched in the ADAR1-p110 and ADAR2 IP samples are shown in green and purple, respectively. Red arrow: ADAR1-p110-bound pre-miRNA that was found to be edited as non-mature by ADAR1-p110 (hsa-mir-140). Blue arrows: pre-miRNAs with editing site on the mature form in ADAR1-p110 (hsa-mir-181d-2) or ADAR2 (hsa-mir-7d) fractions (). Orange squares: mature miRNAs for which the opposite strand (5p or 3p) was also present in the same IP fraction, corresponding to the orange dots in (a).
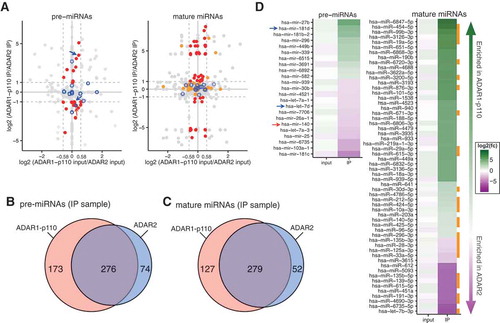
Figure 4. Predicted secondary structure of ADAR-bound pre-miRNAs. Distribution of estimated ∆G (kcal.mol−1) (a), longest double-stranded region with perfect complementarity in pre-miRNAs (b), and loop length (c) in different pre-miRNAs groups. Red box indicates “ADAR1-p110“-bound pre-miRNAs; blue, “ADAR2“-bound pre-miRNAs; green, ‘Expressed pre-miRNAs’ indicates all pre-miRNAs registered in miRBase which have both 5p and 3p annotations and expressed in both ADAR1-p110 and ADAR2 input samples. Error bars indicate standard deviation. BPP of pre-miRNAs (d) or mature miRNA duplexes (f) enriched in either ADAR1-p110 (red) or ADAR2 (blue) IP samples estimated by CentroidFold. All pre-miRNAs (d) or candidate mature miRNA duplexes (f) are shown in green. The abscissa indicates the relative distance measured from the loop middle point (set as 0, with −1 as the 3ʹ end of 5p miRNA, and + 1 as the 5ʹ end of 3p miRNA) in each individual pre-miRNA, defined by the output of secondary structure prediction. Numbers in parentheses indicate the number of miRNA species in each category. Green circles indicate the positions at which average BPPs significantly differ from those of ‘expressed pre-miRNAs’ (d) and ‘mature miRNA duplexes’ (f), respectively (Bootstrap-t method, Figure S7). Schematic secondary structures of pre-miRNAs (e) and candidate mature miRNA duplexes (g) enriched in the ADAR1-p110 IP or ADAR2 IP fractions, respectively. Red and blue lines: regions with significantly high BPPs compared to control; red and blue dotted lines: with significantly low BPPs in either 5p or 3p; gray lines: positions with no significance; gray dotted lines: positions with no significance for which the mean BPP of both 5p or 3p was lower than control.
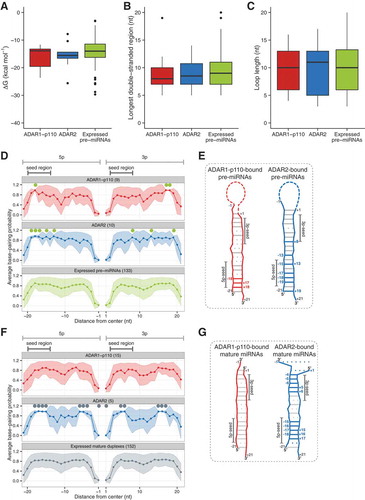
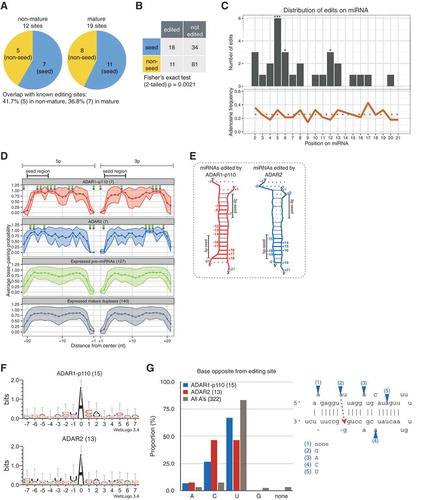
Figure 5. Positional, structural, and sequence editing preferences for each ADAR isoform on non-mature and mature miRNA. (a) Editing sites observed within non-seed (yellow) or seed (blue) regions of edited non-mature and mature miRNAs. Note that there is no overlap of editing sites between non-mature and mature miRNAs. (b) 2 × 2 contingency table describing the total number of edited or non-edited adenosines in the seed or non-seed regions (Fisher’s exact test, p < 0.01). (c) Top: distribution of editing sites along miRNA; Fisher’s exact test was performed by comparing the proportion of edited adenosines at each position compared to all the other positions (*** p < 0.01; ** p < 0.05; * p < 0.1); bottom: proportion of adenosines at each position along edited miRNA species from + 1 to + 21; dotted line: average frequency of adenosine. BPPs of edited ‘mature miRNA duplexes’ (d) and their predicted secondary structures (e) estimated by CentroidFold. (f) Editing motifs for each ADAR isoform generated using WebLogo version 3.4 (39) from sequences ranging from positions −7 to + 7 centered around the editing site. Bit score (log2) was normalized to the global nucleotide frequencies within human miRNA hairpin sequences obtained from miRBase. (g) Left: composition of nucleotides opposite from editing sites for ADAR1-p110 (red), ADAR2 (blue), and all adenosines within duplex regions (dark gray); left: schematic representation of the way opposite bases were assessed.