Figures & data
Figure 1. The distribution of the number of kNN lists a point showed for the miRNAs and diseases in our dataset. Nk means the number of kNN lists a point showed, P(Nk) means the number of points showed in Nk kNN lists.
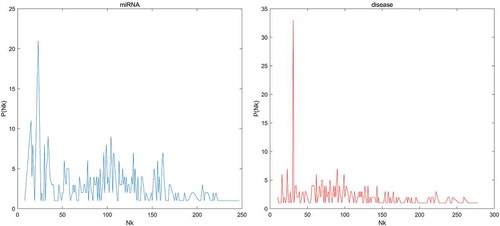
Figure 2. Performance comparison between BLHARMDA and seven classical disease-miRNA association prediction models (MCMDA, HGIMDA, WBSMDA, HDMP, RLSMDA, MaxFlow and RKNNMDA) in terms of ROC curves and AUCs based on global LOOCV and comparison of AUCs based on the local LOOCV between BLHARMDA and above seven models and three local models (RLSMDA, MiRAI, MIDP). As a result, BLHARMDA outperformed other models by achieving an AUC of 0.9141 in global LOOCV and an AUC of 0.8390 in local LOOCV.
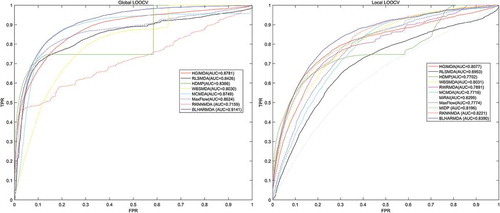
Table 1. Kolmogorov-Smirnov test based on the local LOOCV results between BLHARMDA and other ten algorithms compared in local LOOCV.
Table 2. Prediction of the top 50 potential Esophageal Neoplasms-related miRNAs based on known associations in HMDD v2.0 database. The first column records top 1–25 related miRNAs. The third column records the top 26–50 related miRNAs. The evidences for the associations were either dbDEMC and miR2Disease.
Table 3. Prediction of the top 50 potential Lung Neoplasms-related miRNAs based on known associations in HMDD v2.0 database. In this case study, we hided all known related miRNAs for each investigated disease before the prediction process. The first column records top 1–25 related miRNAs. The third column records the top 26–50 related miRNAs. The evidences for the associations were either HMDD v2.0, dbDEMC and miR2Disease.
Table 4. Prediction of the top 50 potential Carcinoma Neoplasms-related miRNAs based on known associations in the HMDD v1.0 database. The first column records top 1–25 related miRNAs. The third column records the top 26–50 related miRNAs. The evidences for the associations were either HMDD v2.0, dbDEMC and miR2Disease.
Table 5. Here, we used the studies published after 2014 in PubMed to further evaluate the top 50 potential Esophageal Neoplasms-related miRNAs. We provided the PMID and published year of these studies in the table. The result showed that 46 out of the top 50 predictions were confirmed by the experimental literatures published after 2014 in PubMed.
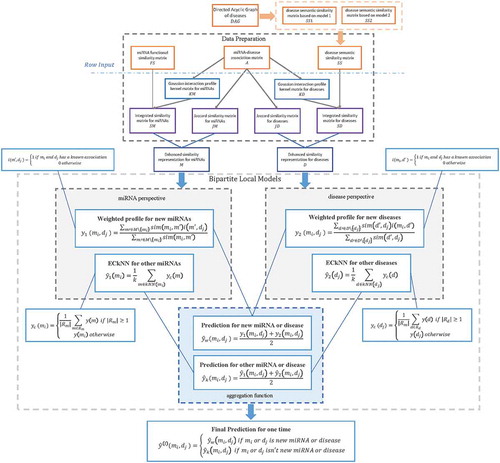
Figure 3. Flowchart of potential miRNA-disease association prediction based on the computational model of BLHARMDA: 1) data preparation, where enhanced similarity representation for miRNAs and diseases were constructed in this step; 2) Training the BLM with ECkNN as the local model and making predictions for the miRNAs or diseases with known associations by the BLM we trained. Then, using the weighted profile method to make prediction for new miRNAs and diseases.