Figures & data
Table 1. Chirp-Seq data set used in this paper. The table shows number of peaks obtained from ChIRP-Seq of 12 lncRNAs. Genome and GEO accession number are also shown for each ChIRP-Seq data set.
Figure 1. Convolutional neural network and recurrent neural network layers. (A) Illustration of CNN model with the input layer (sequence) as one-hot encoded followed by a CNN layer followed by a global max pooling layer and output layer with a single node with sigmoid activation function. (B) Illustration of a RNN model with the input layer (sequence) as one-hot encoded followed by a concatenated bidirectional LSTM layer followed by an output layer with single node with sigmoid activation.
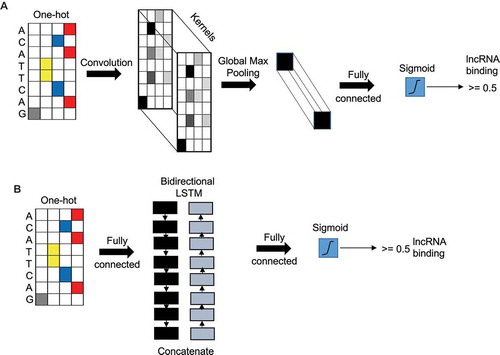
Table 2. Architecture of selected models tested in this study. The miniCNN, smallCNN, mediumCNN, largeCNN, and verylargeCNN models have one 1, 2, 3, 4, and 7 CNN layers, respectively. The number of kernels, and their sizes (within parentheses) are indicated under column ‘Conv kernels’. The pooling size is indicated under ‘Pooling size’. The three smallRNN models had one LSTM layer each. The sizes of LSTM nodes are indicated under column ‘LSTM size’. Pooling layer after the last CNN layer was based in ‘Global Max’, and pooling layer for other layers a local max pooling function of size 10 was used.
Figure 2. Performance of CNN models. Performance of 15 different CNN models are shown for six different evaluation metrics. Three learning rates were tested. See specifications of the models in .
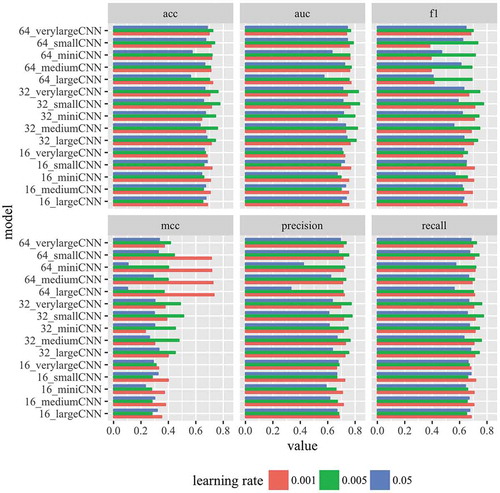
Table 3. Performance of feature-based models. Three feature-based models were tested using 6 evaluation metrics.
Table 4. Triplex forming domains (TFDs) of lncRNAs. (A) Table indicates the number of triplex forming domains/oligos (TFDs) in lncRNAs. Isoforms are separated for lncRNAs with multiple isoforms. (B) Table indicates locations and sequence of triplex forming domains for two example lncRNAs: Human HOTAIR, and mouse MEG3 isoform NR_027652.1. Bolded TFDs have been experimentally validated by previous studies.
Figure 3. Electrophoretic mobility shift assays support triple helix formation. Triple helix formation between (A) HOTAIR novel TFD and HOXD3 and (B) TUG1 novel TFD and PPARGC1A, which were considered for in vitro validation. (C and D) Electrophoretic mobility shift assay of predicted binding domains (HOTAIR and TUG1). Complementary oligodeoxynucleotides were preincubated to form double stranded DNA and then incubated with either specific RNA of predicted triplex binding in HOTAIR (C) and TUG1 (D), or non-specific control RNA. RNA was applied in 25-fold or 50-fold excess; 1.1 equivalents were used of the pyrimidine-rich DNA strand to reduce the possibility of DNA:DNA-DNA triplex formation. A mobility shift that indicates triplex formation was only observed with the specific sequences of HOTAIR and TUG1 TFDs. Triplex formation increased wth the increased in concentrations of RNAs: HOTAIR (E) and TUG1 (F).
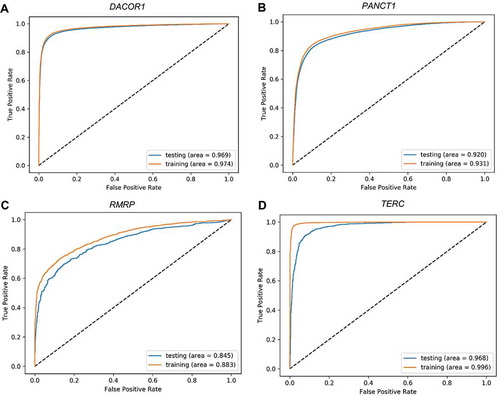
Figure 4. Receiver Operating Characteristic (ROC) plots for training and testing sets. Four representative ROC plots for the best deep learning model representing four lncRNAs: TUG1 (A), HOTAIR (B), HOTCHON (C), and DACOR1 (D). Area under the curve for testing and training sets are shown for each plot.