Figures & data
Figure 1. Malat1 is not required for early T cell development. (a) Expression of Malat1 and key transcription factors of T cell development in different T cell subsets from published RNA-seq. (b) Analysis of Malat1 expression in thymocytes and peripheral T cells by quantitative RT-PCR. Relative gene expression levels in each sample were normalized to Hprt1. (c) Analysis of Malat1 expression in thymus, spleen and bone marrow from wild-type (Ctrl) and Malat1−/- mice. Relative gene expression levels in each sample were normalized to Hprt1. (d-e) The size (d) and cellularity (e) of thymus and spleen from wild-type (Ctrl) and Malat1−/- mice. (f) Surface staining of CD4 and CD8 on thymocytes and CD25 and CD44 on DN thymocytes. (g-h) The percentages (g) and numbers (h) of thymocytes in f. (i) Expression of TCRβ in DN3, DN4 and DP thymocytes. Data represent mean ± s.d.
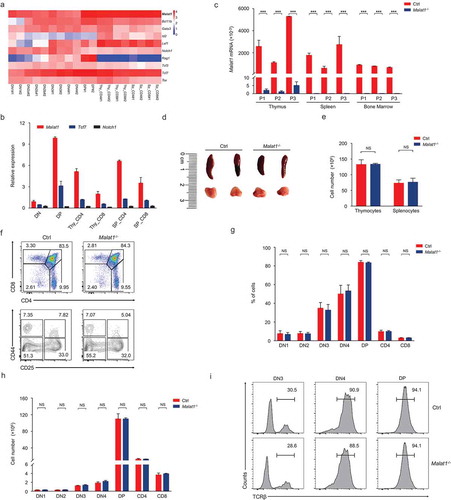
Figure 2. Ablation of Malat1 does not alter late T cell development and migration. (a-b) Flow cytometry analysis of post-selection TCRβhi thymocytes. The percentages (left) and numbers (right) of post-selection TCRβhi thymocytes are shown in b. (c-d) Flow cytometry analysis of mature (CD24−CD69−) thymocytes (bottom left) and immature (CD24+CD69+) thymocytes (top right) gated on post-selection TCRβhi thymocytes. The frequency (left) and numbers (right) of immature and mature subsets are shown in d. (e-f) Flow cytometry analysis of CD4+ SP, CD4+CD8lo, DP and CD8+ SP subsets gated on immature CD24+CD69+ TCRβhi thymocytes. The percentages (left) and numbers (right) of indicated subsets are shown in f. (g-h) Flow cytometry analysis of CD4+ and CD8+ subsets gated on mature CD24−CD69− TCRβhi thymocytes. The frequency (left) and numbers (right) of CD4+ and CD8+ subsets are shown in h. (i-j) Flow cytometry analysis of CD4+ and CD8+ T cells in peripheral blood cells (left column) and spleen (right column). The percentages (left) and numbers (right) of peripheral T cells are shown in j. Data represent mean ± s.d.
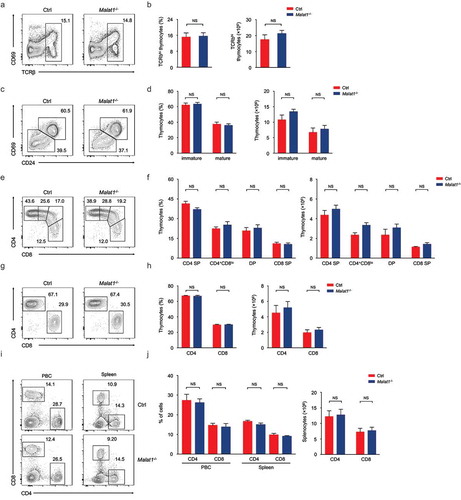
Figure 3. Malat1 is dispensable for TFH differentiation. (a-b) Flow cytometry analysis of CD4+ T cell pool at 8 days after infection. The percentage (left) and number (right) of effector CD4+ T cells are shown in b. (c) Flow cytometry analysis of SLAM− CXCR5+ TFH cells (top), PD-1hiCXCR5+ GC TFH cells (middle), and Bcl-6hiCXCR5+ GC TFH cells (bottom) at day 8 after LCMV infection. (d-e) The percentages (d) and numbers (e) of TFH cells in c. (f) Analysis of GC B cells (top) and plasma cells (bottom) in spleen by flow cytometry. (g) The percentages (left) and numbers (right) of GC B and plasma cells in f. (h) Analysis of LCMV-specific IgG (left) and IgM (right) in the sera after LCMV infection. Data represent mean ± s.d.
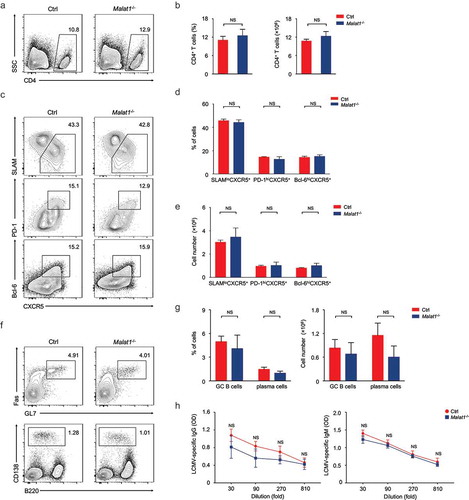
Figure 4. Malat1 is not essential for effector differentiation of CD8+ T cell. (a) Analysis of CD8+ T cells expansion at 8 days after infection. (b) The percentage (left) and number (right) of effector CD8+ T cells in a. (c) Analysis of surface expression of CD44, CD62L, KLRG1 and CD127 from day 8 effector T cells. (d-e) The percentages (d) and numbers (e) of effector T cells in c. (f) Production of effector molecules IFN-γ and TNF-α by effector T cells. (g) The percentages (left) and numbers (right) of IFN-γ+CD8+ and TNF-α+CD8+ T cells in f. (h) Expression of Granzyme B (GzmB) from day 8 effector T cells. (i) Intracellular staining of Eomes and T-bet expression in CD8+ T cells 8 days post infection. Data represent mean ± s.d.
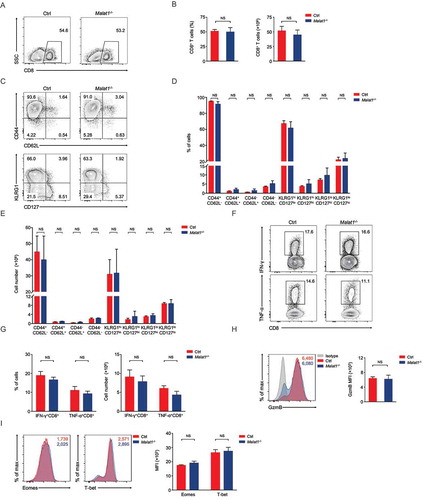
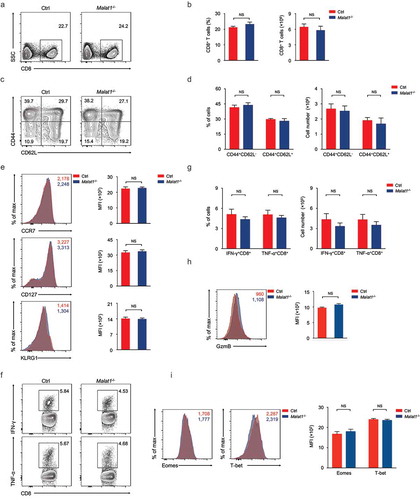
Figure 5. Ablation of Malat1 exhibited normal memory CD8+ T cell pool formation. (a) Analysis of memory CD8+ T cells pool at 72 days after infection. (b) The percentage (left) and number (right) of effector CD8+ T cells in a. (c) Analysis of TEM (CD44+CD62L−) and TCM (CD44+CD62L+) gated on CD8+ T cells. (d) The percentages (left) and numbers (right) of TEM (CD44+CD62L−) and TCM (CD44+CD62L+) in c. (e) Analysis of the expression of CCR7 (top), CD127 (middle), and KLRG1 (bottom) by memory CD8+ T cells. (f) Analysis of the secretion of IFN-γ (top) and TNF-α (bottom) by memory CD8+ T cells. (g) The percentages (left) and numbers (right) of IFN-γ+CD8+ and TNF-α+CD8+ T cells in f. (h) Analysis of the production of Granzyme B by memory CD8+ T cells. (i) Analysis of the expression of Eomes (left) and T-bet (right) by memory CD8+ T cells. Data represent mean ± s.d.