Figures & data
Figure 1. Identification of DELs in neuronal differentiation of hNPCs. (a–b) represents the heatmap of upregulated and downregulated DELs respectively. (c–d) shows GO analysis of upregulated and downregulated DELs respectively.
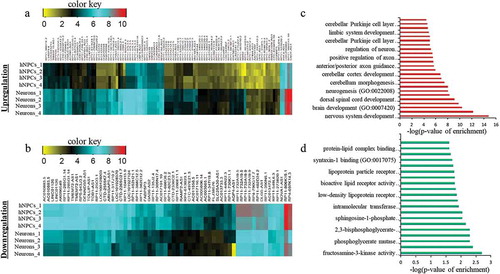
Figure 2. ChIP-seq analysis of H3K4me3 and H3K27me3 of DELs during neuronal differentiation. (a–b) shows the ChIP-seq scores of H3K4me3 of upregulated (p ≤ 2.3 × 10⁻⁷) and downregulated (p ≤ 1.5 × 10⁻¹⁹) DELs. (c–d) shows the ChIP-seq scores of H3K27me3 of upregulated (p ≤ 0.06) and downregulated (p ≤ 0.7) DELs.
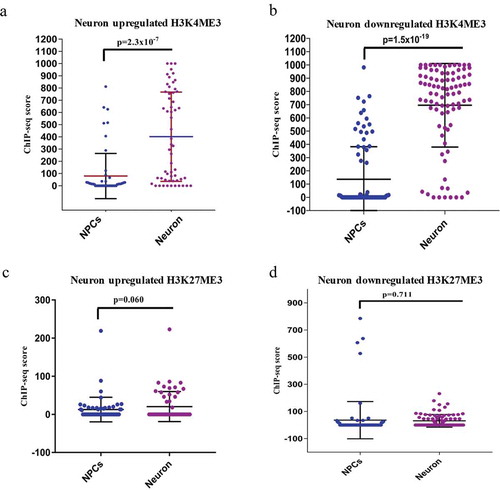
Figure 3. Identification of DELs in astroglial differentiation of hNPCs. a-b represent the heatmap of upregulated and downregulated DELs respectively. c-d shows GO analysis of upregulated and downregulated DELs respectively.
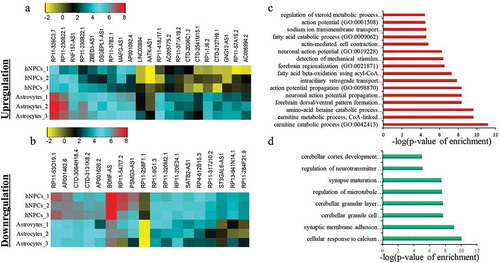
Figure 4. ChIP-seq analysis of H3K4me3 and H3K27me3 of DELs during astroglial differentiation. (a–b) shows the ChIP-seq scores of H3K4me3 of upregulated (p ≤ 6.1 × 10⁻⁴) and downregulated (p ≤ 9.8 × 10⁻⁸) DELs. (c–d) shows the ChIP-seq scores of H3K27me3 of upregulated (p ≤ 0.027) and downregulated (p ≤ 0.132) DELs.
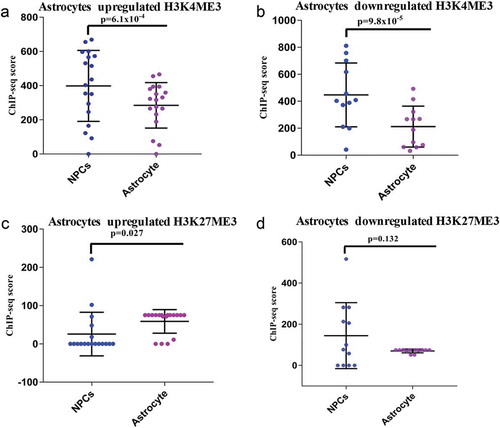
Figure 5. Verification of DELs in hNPCs and differentiated neurons and astrocytes. (a) Phase-contrast image of hNPCs derived neurosphere, (b) ICC images of hNPCs showing positive for NESTIN and SOX2 markers, (c) hNPCs derive neurons were positive for neuronal markers MAP2 and TUJ1, (d) hNPCs derive astrocytes were positive for GFAP and S100β, (e) relative expression of significantly upregulated lncRNAs, AQP4-AS1, CYP-AS1 and LHX-AS1 during neuronal differentiation in our hNPCs culture system, (f) relative expression of significantly downregulated lncRNAs, SPAG5-AS1 and SBTB-AS1 during neuronal differentiation, (g) relative expression of significantly upregulated lncRNAs, RNF-AS1 and CCNT2-AS1 during astrocytic differentiation, (h) relative expression of significantly downregulated lncRNAs, PRKAG-AS1, KRTAP-AS1 and PSMG-AS1 during astrocytic differentiation. *p ≤ 0.05, **p ≤ 0.005, ***p ≤ 0.0005, student t-test.
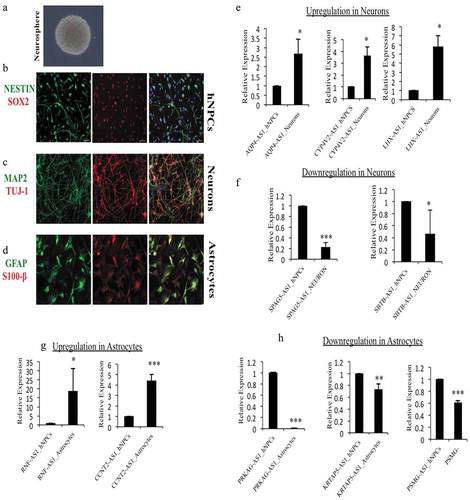
Figure 6. Divergent DELs promoters have higher number of H3K4me3 imprints during neural differentiation.(a) represent the percentage of upregulated and downregulated DELs having H3K4me3 histone marks during neural differentiation of hNPCs. (b) represent the percentage of upregulated and downregulated DELs having H3K4me3 markers during astroglial differentiation of hNPCs. Around 81% of DELs were positive for H3K4me3 histone marks during neural differentiation, while only there were around 36–39% present on DELs promoter during astroglial differentiation, which shows the impact of epigenetic effect of XH lncRNAs on neural differentiation. (c) represent the percentage of upregulated and downregulated DELs having H3K27me3 histone marks during neural differentiation of hNPCs. (b) represent the percentage of upregulated and downregulated DELs having H3K27me3 markers during astroglial differentiation of hNPCs.
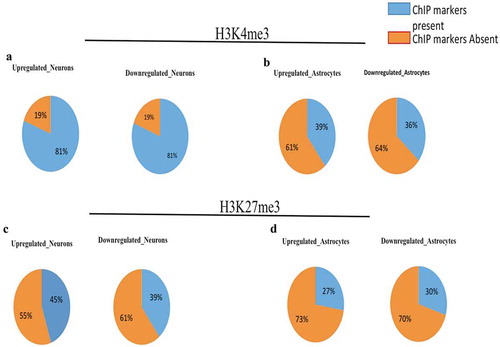
Figure 7. Comparision of Euchromatinization using DNase-seq data in hESCs, hNPCs, neuron and astrocytes. (a–d) Heatmaps of DNase-seq Reads Per Kilobase Million (RPKM) in hESCs, hNPCs, neurons and astrocytes of ENCODE datasets. (e) showing enrichment scores using plotprofile of each cell types, (f) Comparision of DNase-seq scores of dELs in hNPCs, Neurons and ESCs, (g) Comparision of DNase-seq scores of dELs in hNPCs, Astrocytes and ESCs.
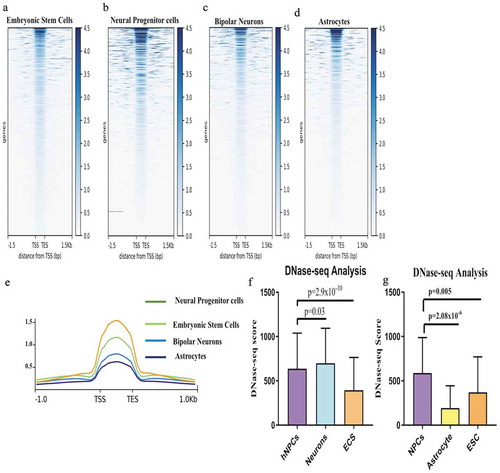
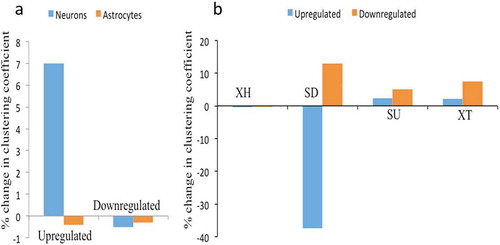
Figure 8. Network analysis of XH lncRNAs and other biotypes during hNPCs differentiation. (A) showing change in clustering coefficient during neuronal differentiation and astroglial differentiation in upregulated and downregulated DELs, XH lncRNAs shows increase in network strength only during neuronal differentiation of hNPCs, (B) showing change in clustering coefficient of other lncRNAs biotypes during astroglial differentiation of hNPCs, SD biotypes shows the maximum changes in network strength during astroglial differentiation.